|
|
市場調査レポート
商品コード
1699422
工業用バルブ市場の機会、成長促進要因、産業動向分析、2025年~2034年の予測Industrial Valve Market Opportunity, Growth Drivers, Industry Trend Analysis, and Forecast 2025-2034 |
||||||

|
|||||||
カスタマイズ可能
|
|||||||

| 工業用バルブ市場の機会、成長促進要因、産業動向分析、2025年~2034年の予測 |
|
出版日: 2025年02月27日
発行: Global Market Insights Inc.
ページ情報: 英文 220 Pages
納期: 2~3営業日
|

全表示
- 概要
- 目次
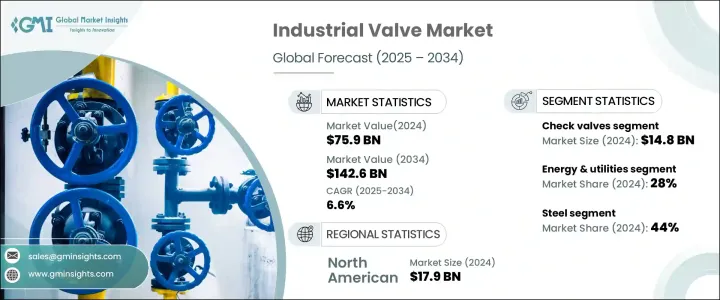
工業用バルブの世界市場は、2024年には759億米ドルとなり、2025年から2034年にかけてCAGR 6.6%で拡大すると予測されています。
この成長の主な要因は、工業化の進展、様々な分野での需要の急増、世界のインフラ開発などです。産業が進化し続けるにつれて、信頼性が高く効率的なバルブシステムの必要性はますます重要になってきています。工業用バルブは、液体、気体、スラリーの流れを複数の用途にわたって管理し、作業効率と安全性を確保する上で不可欠なコンポーネントです。
バルブシステム、特にスマートで自動化されたソリューションの技術的進歩が、市場拡大の原動力となっています。IoTやAI主導の監視システムの統合を含む流体制御アプリケーションの革新により、産業界は操作の精度と効率の向上を実現しています。企業が資源管理を最適化し、ダウンタイムを最小限に抑えようとする中、インテリジェントバルブソリューションの採用が勢いを増しています。さらに、上下水処理プロジェクトへの投資の増加や、産業環境におけるエネルギー効率の高いソリューションへのニーズの高まりが、市場の需要をさらに押し上げています。持続可能性への注目の高まりも、厳しい環境規制に対応した環境に優しく高性能なバルブソリューションの開発をメーカーに促しています。
| 市場範囲 | |
|---|---|
| 開始年 | 2024 |
| 予測年 | 2025-2034 |
| 開始金額 | 759億米ドル |
| 予測金額 | 1,426億米ドル |
| CAGR | 6.6% |
工業用バルブ市場は、ボールバルブ、逆止弁、バタフライバルブ、グローブバルブ、ゲートバルブ、ダイヤフラムバルブ、プラグバルブ、その他を含むタイプ別に分類されます。2024年には、逆流防止とシステム保護を必要とする産業で広く使用されていることを裏付けるように、逆止弁セグメントだけで148億米ドルと評価されました。業界を形成する主要動向は、過酷な条件下での耐久性と運用効率を高めるために設計された、耐腐食性合金や高性能ポリマーなどの先端材料の使用です。これは、バルブが高圧、極端な温度、腐食環境にさらされる石油・ガス、水処理、化学処理などの分野で特に重要です。
最終用途産業別では、市場は化学、エネルギー・公益事業、建設、金属・鉱業、農業、飲食品、パルプ・製紙、その他に区分されます。再生可能エネルギー源への世界の移行と従来型エネルギー発電の持続的な必要性により、エネルギー・公益事業セクターが2024年のシェア28%で市場をリードしています。工業用バルブは、発電所、パイプライン、エネルギーインフラにおける流体の流れを管理する上で極めて重要な役割を果たしています。各国が脱炭素化を目指す中、風力、太陽光、水素エネルギー用途の特殊バルブの需要が増加しており、市場成長の見通しが強まっています。
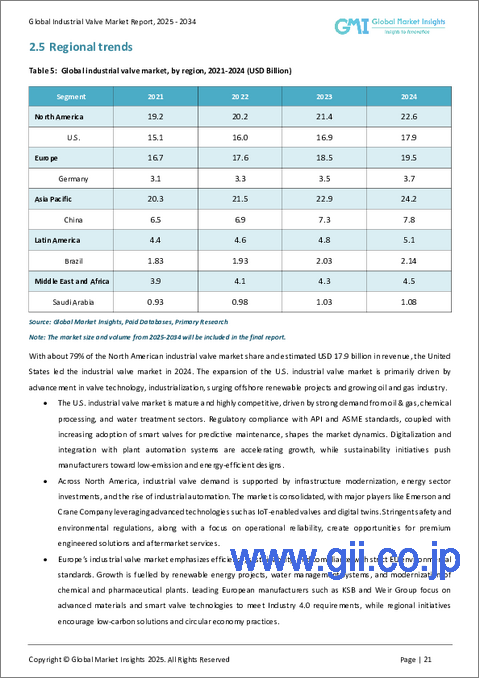
北米の工業用バルブ市場は79%のシェアを占め、2024年には179億米ドルを生み出します。このリーダーシップは、バルブ技術の継続的な進歩、産業の力強い成長、オフショア再生可能プロジェクトの拡大に起因しています。この地域の石油・ガス産業の繁栄とスマートバルブソリューションの需要の高まりが、市場成長の原動力となっています。米国では洋上風力発電所の開発が進んでおり、高性能な工業用バルブのニーズがさらに加速しており、クリーンエネルギー構想を支える国内サプライチェーン強化の重要性が強調されています。産業界がより高い効率性と規制遵守を推進する中、次世代バルブソリューションへの需要は高まり続けており、世界の工業用バルブ市場の将来を形成しています。
目次
第1章 調査手法と調査範囲
第2章 エグゼクティブサマリー
第3章 業界洞察
- エコシステム分析
- バリューチェーンに影響を与える要因。
- 利益率分析
- ディスラプション
- 将来の展望
- メーカー
- 流通業者
- サプライヤーの情勢
- 技術的展望
- 主要ニュース&イニシアチブ
- 規制状況
- 影響要因
- 促進要因
- さまざまな最終用途産業からの需要の高まり
- インフラ開発と工業化の進展
- 業界の潜在的リスク&課題
- インフラの老朽化
- 標準化された政策の欠如
- 促進要因
- 成長可能性分析
- ポーター分析
- PESTEL分析
第4章 競合情勢
- イントロダクション
- 企業シェア分析
- 競合のポジショニング・マトリックス
- 戦略展望マトリックス
第5章 市場推計・予測:タイプ別、2021年~2034年
- 主要動向
- ボールバルブ
- チェックバルブ
- バタフライバルブ
- ゲートバルブ
- グローブバルブ
- プラグバルブ
- ダイヤフラムバルブ
- その他(安全弁など)
第6章 市場推計・予測:材料別、2021年~2034年
- 主要動向
- スチール
- プラスチック
- 鋳鉄
- 合金ベース
- その他(青銅、真鍮など)
第7章 市場推計・予測:コンポーネント別、2021年~2034年
- 主要動向
- アクチュエータ
- バルブ本体
- その他(ポジショナー、i/Pコンバーターなど)
第8章 市場推計・予測:サイズ別、2021年~2034年
- 主要動向
- 1インチ
- 1インチ~6インチ
- 7インチ~25インチ
- 26インチ~50インチ
- 50インチ超
第9章 市場推計・予測:最終用途産業別、2021年~2034年
- 主要動向
- 化学
- エネルギー・公益事業
- 建設
- 金属・鉱業
- 農業
- 製薬
- 飲食品
- パルプ・製紙
- その他
第10章 市場推計・予測:流通チャネル別、2021年~2034年
- 主要動向
- 直接販売
- 間接販売
第11章 市場推計・予測:地域別、2021年~2034年
- 主要動向
- 北米
- 米国
- カナダ
- 欧州
- 英国
- ドイツ
- フランス
- イタリア
- スペイン
- ロシア
- アジア太平洋
- 中国
- インド
- 日本
- 韓国
- オーストラリア
- ラテンアメリカ
- ブラジル
- メキシコ
- 中東・アフリカ
- UAE
- サウジアラビア
- 南アフリカ
第12章 企業プロファイル
- Alfa Laval
- AVK Holding
- Baker Hughes
- CIRCOR
- Crane Company
- Curtiss-Wright
- Danfoss
- Emerson Electric
- Hitachi
- Honeywell
- KITZ
- KSB
- SLB
- The Weir Group
- Watts
The Global Industrial Valve Market was valued at USD 75.9 billion in 2024 and is projected to expand at a CAGR of 6.6% between 2025 and 2034. This growth is primarily fueled by increasing industrialization, surging demand across various sectors, and significant infrastructure development worldwide. As industries continue to evolve, the need for reliable and efficient valve systems is becoming more critical. Industrial valves are essential components in managing the flow of liquids, gases, and slurries across multiple applications, ensuring operational efficiency and safety.
Technological advancements in valve systems, particularly in smart and automated solutions, are driving market expansion. Innovations in fluid control applications, including the integration of IoT and AI-driven monitoring systems, are enabling industries to achieve enhanced precision and efficiency in operations. As companies seek to optimize resource management and minimize downtime, the adoption of intelligent valve solutions is gaining momentum. Additionally, increasing investments in water and wastewater treatment projects, along with the growing need for energy-efficient solutions in industrial settings, are further propelling market demand. The rising focus on sustainability is also pushing manufacturers to develop eco-friendly and high-performance valve solutions that align with stringent environmental regulations.
| Market Scope | |
|---|---|
| Start Year | 2024 |
| Forecast Year | 2025-2034 |
| Start Value | $75.9 Billion |
| Forecast Value | $142.6 Billion |
| CAGR | 6.6% |
The industrial valve market is categorized by type, including ball valves, check valves, butterfly valves, globe valves, gate valves, diaphragm valves, plug valves, and others. In 2024, the check valve segment alone was valued at USD 14.8 billion, underscoring its widespread use across industries that require backflow prevention and system protection. A major trend shaping the industry is the use of advanced materials, such as corrosion-resistant alloys and high-performance polymers, designed to enhance durability and operational efficiency under extreme conditions. This is particularly crucial in sectors such as oil and gas, water treatment, and chemical processing, where valves are subjected to high pressure, extreme temperatures, and corrosive environments.
By end-use industry, the market is segmented into chemical, energy and utilities, construction, metal and mining, agriculture, pharmaceutical, food and beverages, pulp and paper, and others. The energy and utilities sector led the market with a 28% share in 2024, driven by the global transition toward renewable energy sources and the sustained need for conventional energy generation. Industrial valves play a pivotal role in managing fluid flow in power plants, pipelines, and energy infrastructure. As nations work toward decarbonization goals, the demand for specialized valves in wind, solar, and hydrogen energy applications is increasing, reinforcing the market growth prospects.
North America Industrial Valve Market accounted for a dominant 79% share, generating USD 17.9 billion in 2024. This leadership is attributed to continuous advancements in valve technology, strong industrial growth, and the expansion of offshore renewable projects. The region's thriving oil and gas industry, coupled with the rising demand for smart valve solutions, is driving market growth. The ongoing development of offshore wind farms in the United States has further accelerated the need for high-performance industrial valves, emphasizing the importance of strengthening domestic supply chains to support clean energy initiatives. As industries push for greater efficiency and regulatory compliance, the demand for next-generation valve solutions continues to rise, shaping the future of the global industrial valve market.
Table of Contents
Chapter 1 Methodology & Scope
- 1.1 Market scope & definitions
- 1.2 Base estimates & calculations
- 1.3 Forecast calculations.
- 1.4 Data sources
- 1.4.1 Primary
- 1.4.2 Secondary
- 1.4.2.1 Paid sources
- 1.4.2.2 Public sources
Chapter 2 Executive Summary
- 2.1 Industry synopsis, 2021-2034
Chapter 3 Industry Insights
- 3.1 Industry ecosystem analysis
- 3.1.1 Factor affecting the value chain.
- 3.1.2 Profit margin analysis.
- 3.1.3 Disruptions
- 3.1.4 Future outlook
- 3.1.5 Manufacturers
- 3.1.6 Distributors
- 3.2 Supplier landscape
- 3.3 Technological landscape
- 3.4 Key news & initiatives
- 3.5 Regulatory landscape
- 3.6 Impact forces
- 3.6.1 Growth drivers
- 3.6.1.1 Rising demand from various end use industries
- 3.6.1.2 Infrastructure development and surging industrialization
- 3.6.2 Industry pitfalls & challenges
- 3.6.2.1 Aging infrastructure
- 3.6.2.2 Lack of standardized policies
- 3.6.1 Growth drivers
- 3.7 Growth potential analysis
- 3.8 Porter's analysis
- 3.9 PESTEL analysis
Chapter 4 Competitive Landscape, 2024
- 4.1 Introduction
- 4.2 Company market share analysis
- 4.3 Competitive positioning matrix
- 4.4 Strategic outlook matrix
Chapter 5 Market Estimates & Forecast, By Type, 2021-2034 (USD Billion) (Thousand Units)
- 5.1 Key trends
- 5.2 Ball valves
- 5.3 Check valves
- 5.4 Butterfly valves
- 5.5 Gate valves
- 5.6 Globe valves
- 5.7 Plug valves
- 5.8 Diaphragm valves
- 5.9 Others (safety valves etc.)
Chapter 6 Market Estimates & Forecast, By Material, 2021-2034 (USD Billion) (Thousand Units)
- 6.1 Key trends
- 6.2 Steel
- 6.3 Plastic
- 6.4 Cast iron
- 6.5 Alloy based
- 6.6 Others (bronze and brass etc.)
Chapter 7 Market Estimates & Forecast, By Component, 2021-2034 (USD Billion) (Thousand Units)
- 7.1 Key trends
- 7.2 Actuators
- 7.3 Valve body
- 7.4 Others (positioners and I/P converters etc.)
Chapter 8 Market Estimates & Forecast, By Size, 2021-2034 (USD Billion) (Thousand Units)
- 8.1 Key trends
- 8.2 1”
- 8.3 1” to 6”
- 8.4 7” to 25”
- 8.5 26” to 50”
- 8.6 >50”
Chapter 9 Market Estimates & Forecast, By End Use Industry, 2021-2034 (USD Billion) (Thousand Units)
- 9.1 Key trends
- 9.2 Chemical
- 9.3 Energy & utilities
- 9.4 Construction
- 9.5 Metal & mining
- 9.6 Agriculture
- 9.7 Pharmaceutical
- 9.8 Food & beverages
- 9.9 Pulp & paper
- 9.10 Others
Chapter 10 Market Estimates & Forecast, By Distribution Channel, 2021-2034 (USD Billion) (Thousand Units)
- 10.1 Key trends
- 10.2 Direct sales
- 10.3 Indirect sales
Chapter 11 Market Estimates & Forecast, By Region, 2021-2034 (USD Billion) (Thousand Units)
- 11.1 Key trends
- 11.2 North America
- 11.2.1 U.S.
- 11.2.2 Canada
- 11.3 Europe
- 11.3.1 UK
- 11.3.2 Germany
- 11.3.3 France
- 11.3.4 Italy
- 11.3.5 Spain
- 11.3.6 Russia
- 11.4 Asia Pacific
- 11.4.1 China
- 11.4.2 India
- 11.4.3 Japan
- 11.4.4 South Korea
- 11.4.5 Australia
- 11.5 Latin America
- 11.5.1 Brazil
- 11.5.2 Mexico
- 11.6 MEA
- 11.6.1 UAE
- 11.6.2 Saudi Arabia
- 11.6.3 South Africa
Chapter 12 Company Profiles
- 12.1 Alfa Laval
- 12.2 AVK Holding
- 12.3 Baker Hughes
- 12.4 CIRCOR
- 12.5 Crane Company
- 12.6 Curtiss-Wright
- 12.7 Danfoss
- 12.8 Emerson Electric
- 12.9 Hitachi
- 12.10 Honeywell
- 12.11 KITZ
- 12.12 KSB
- 12.13 SLB
- 12.14 The Weir Group
- 12.15 Watts
