
|
市場調査レポート
商品コード
1698606
ソーラートラッカー市場の機会、成長促進要因、産業動向分析、2025年~2034年の予測Solar Tracker Market Opportunity, Growth Drivers, Industry Trend Analysis, and Forecast 2025-2034 |
||||||
カスタマイズ可能
|
|||||||
| ソーラートラッカー市場の機会、成長促進要因、産業動向分析、2025年~2034年の予測 |
|
出版日: 2025年02月14日
発行: Global Market Insights Inc.
ページ情報: 英文 130 Pages
納期: 2~3営業日
|

全表示
- 概要
- 目次
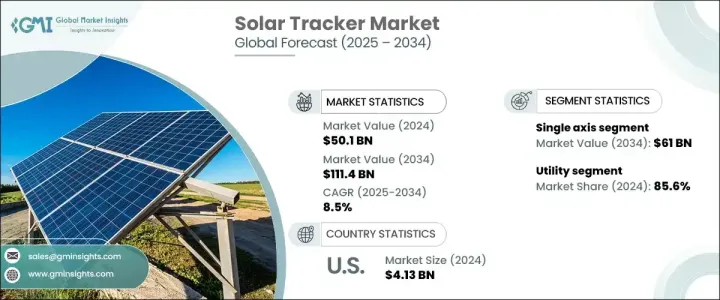
ソーラートラッカーの世界市場規模は2024年に501億米ドルとなり、2025年から2034年にかけてCAGR 8.5%で成長すると予測されています。
太陽光発電システムの効率向上とソーラートラッカーのコスト低下が相まって、業界の成長を牽引しています。これらのシステムは太陽電池パネルの性能を向上させ、単軸トラッカーは固定チルト設置に比べてエネルギー出力を10~25%、二軸トラッカーは最大40%向上させる。スマートグリッド技術とIoTの統合により、エネルギー生産の監視、制御、最適化が改善され、市場拡大が加速します。単軸トラッカーを搭載した二面式太陽電池モジュールの採用が増加しており、従来の単面式システムと比べて電力料金の平準化コストを約16%削減できると予想され、製品需要をさらに促進しています。ソーラートラッカー技術の継続的な進歩は、コストを下げ、効率を向上させ、複数の用途で太陽エネルギーへのアクセス性を高めることで、業界を再形成しています。
市場はまた、エネルギー貯蔵ソリューションの統合、ハイブリッド太陽追尾システムの出現、環境への影響を最小限に抑えるための環境に優しい材料の使用からも恩恵を受けています。米国のインフレ削減法やオーストラリアのソーラー・サンショット・プログラムなど、支援的な規制政策、インセンティブ・プログラム、政府のイニシアティブは、事業の見通しを強化すると予想されます。
| 市場範囲 | |
|---|---|
| 開始年 | 2024 |
| 予測年 | 2025-2034 |
| 開始金額 | 501億米ドル |
| 予測金額 | 1,114億米ドル |
| CAGR | 8.5% |
製品別では、単軸トラッカーと二軸トラッカーに分類されます。単軸トラッカーは、固定チルトシステムと比較して25~35%の効率向上を実現し、2034年までに610億米ドル以上を生み出すと予測されています。材料と設計の進歩により信頼性が向上し、メンテナンスコストの削減と寿命の延長が実現し、製品の採用が進んでいます。さらに、エネルギー収率の向上と効率改善により投資収益率が向上し、業界情勢が強化されています。
市場は、住宅用、商業・工業用、公益事業用に区分されます。2024年には、公益事業分野が市場の85.6%のシェアを占める。複数の世帯が太陽光追尾システムを共有するコミュニティ・ソーラー・プロジェクトの人気が高まっていることが、セグメント拡大に寄与しています。また、スマートホーム技術との統合が進むことで、住宅所有者がエネルギー消費をより効果的に監視・最適化できるようになり、市場の成長を促進しています。
地域別分析では、米国の太陽追尾装置市場は2022年に26億米ドル、2023年に41億米ドル、2024年に41億3,000万米ドルを記録しました。北米は2024年に世界市場シェアの8.5%以上を占めたが、これは有利な政策、豊富な太陽光資源、大規模公共事業の拡大が原動力となっています。連邦および州による優遇措置と、住宅用途向けにトラッカーをより手頃な価格で使いやすくすることを目的とした継続的な技術革新が、業界の見通しを強化すると予想されます。費用対効果の高いトラッキング・ソリューションの継続的な開発は、太陽光インフラへの投資の増加とともに、この地域全体に大きな成長機会を生み出し続けると思われます。
目次
第1章 調査手法と調査範囲
- 調査デザイン
- 基本推定と計算
- 予測モデル
- 1次調査と検証
- 市場定義
第2章 エグゼクティブサマリー
第3章 業界洞察
- 業界エコシステム
- 規制状況
- 業界への影響要因
- 促進要因
- 業界の潜在的リスク&課題
- 成長ポテンシャル分析
- 価格動向分析
- ポーター分析
- PESTEL分析
第4章 競合情勢
- イントロダクション
- 戦略ダッシュボード
- イノベーションとテクノロジーの展望
第5章 市場規模・予測:製品別、2021年~2034年
- 主要動向
- 単一軸
- 水平軸
- 垂直軸
- 二軸
第6章 市場規模・予測:技術別、2021年~2034年
- 主要動向
- 太陽光発電
- CSP
第7章 市場規模・予測:アプリケーション別、2021年~2034年
- 主要動向
- 住宅
- 商業・産業
- ユーティリティ
第8章 市場規模・予測:地域別、2021年~2034年
- 主要動向
- 北米
- 米国
- カナダ
- メキシコ
- 欧州
- 英国
- フランス
- オランダ
- ドイツ
- スウェーデン
- スペイン
- オーストリア
- アジア太平洋
- 中国
- 日本
- 韓国
- インド
- オーストラリア
- インドネシア
- マレーシア
- シンガポール
- タイ
- ニュージーランド
- フィリピン
- ベトナム
- 中東
- サウジアラビア
- アラブ首長国連邦
- ヨルダン
- イスラエル
- アフリカ
- 南アフリカ
- エジプト
- アルジェリア
- ナイジェリア
- モロッコ
- ラテンアメリカ
- ブラジル
- チリ
第9章 企業プロファイル
- ArcelorMittal
- Array Technologies
- Arctech
- All Earth Renewables
- Convert Italia
- Degerenergie
- GameChange Solar
- Gonvarri Solar Steel
- Haosolar
- Ideematec
- Mecasolar
- Nclave
- Nextracker
- Powerway Renewable Energy
- PVHardware
- Scorpius Trackers
- SmartTrak Solar Systems
- Soltec
- STI Norland
- SunPower Corporation
- Trina Solar
The Global Solar Tracker Market was valued at USD 50.1 billion in 2024 and is projected to grow at a CAGR of 8.5% from 2025 to 2034. The increasing efficiency of solar power systems, coupled with the declining costs of solar trackers, is driving industry growth. These systems enhance solar panel performance, with single-axis trackers boosting energy output by 10-25% and dual-axis trackers by up to 40% compared to fixed-tilt installations. The integration of smart grid technologies and IoT allows for improved monitoring, control, and optimization of energy production, accelerating market expansion. The rising adoption of bifacial solar modules with single-axis trackers is expected to reduce the levelized cost of electricity by around 16% compared to traditional monofacial systems, further fueling product demand. Ongoing advancements in solar tracker technology are reshaping the industry by lowering costs, enhancing efficiency, and increasing the accessibility of solar energy across multiple applications.
The market is also benefiting from the integration of energy storage solutions, the emergence of hybrid solar tracking systems, and the use of eco-friendly materials to minimize environmental impact. Supportive regulatory policies, incentive programs, and government initiatives such as the U.S. Inflation Reduction Act and Australia's Solar Sunshot program are expected to strengthen business prospects.
| Market Scope | |
|---|---|
| Start Year | 2024 |
| Forecast Year | 2025-2034 |
| Start Value | $50.1 Billion |
| Forecast Value | $111.4 Billion |
| CAGR | 8.5% |
By product, the market is categorized into single-axis and dual-axis trackers. Single-axis trackers are projected to generate over USD 61 billion by 2034, offering an efficiency increase of 25-35% compared to fixed-tilt systems. Advancements in materials and design have improved reliability, reducing maintenance costs and extending lifespan, which enhances product adoption. Additionally, higher energy yields and efficiency improvements lead to better returns on investment, strengthening the industry landscape.
The market is segmented into residential, commercial & industrial, and utility applications. In 2024, the utility sector held an 85.6% share of the market. The growing popularity of community solar projects, where multiple households benefit from shared solar tracking systems, is contributing to segment expansion. Increasing integration with smart home technologies is also enabling homeowners to monitor and optimize energy consumption more effectively, fostering market growth.
In regional analysis, the U.S. solar tracker market recorded values of USD 2.6 billion in 2022, USD 4.1 billion in 2023, and USD 4.13 billion in 2024. North America held over 8.5% of the global market share in 2024, driven by favorable policies, abundant solar resources, and the expansion of large-scale utility projects. Federal and state incentives, along with continuous innovations aimed at making trackers more affordable and user-friendly for residential applications, are expected to reinforce the industry outlook. The ongoing development of cost-effective tracking solutions, alongside increasing investments in solar infrastructure, will continue to create significant growth opportunities across the region.
Table of Contents
Chapter 1 Methodology & Scope
- 1.1 Research Design
- 1.2 Base estimates & calculations
- 1.3 Forecast model
- 1.4 Primary research & validation
- 1.4.1 Primary sources
- 1.4.2 Data mining sources
- 1.5 Market definitions
Chapter 2 Executive Summary
- 2.1 Industry 3600 synopsis, 2021 – 2034
Chapter 3 Industry Insights
- 3.1 Industry ecosystem
- 3.2 Regulatory landscape
- 3.3 Industry impact forces
- 3.3.1 Growth drivers
- 3.3.2 Industry pitfalls & challenges
- 3.4 Growth potential analysis
- 3.5 Price trend analysis
- 3.6 Porter's analysis
- 3.6.1 Bargaining power of suppliers
- 3.6.2 Bargaining power of buyers
- 3.6.3 Threat of new entrants
- 3.6.4 Threat of substitutes
- 3.7 PESTEL analysis
Chapter 4 Competitive landscape, 2024
- 4.1 Introduction
- 4.2 Strategic dashboard
- 4.3 Innovation & technology landscape
Chapter 5 Market Size and Forecast, By Product, 2021 – 2034 (USD Billion & MW)
- 5.1 Key trends
- 5.2 Single axis
- 5.2.1 Horizontal
- 5.2.2 Vertical
- 5.3 Dual axis
Chapter 6 Market Size and Forecast, By Technology, 2021 – 2034 (USD Billion & MW)
- 6.1 Key trends
- 6.2 PV
- 6.3 CSP
Chapter 7 Market Size and Forecast, By Application, 2021 – 2034 (USD Billion & MW)
- 7.1 Key trends
- 7.2 Residential
- 7.3 Commercial & industrial
- 7.4 Utility
Chapter 8 Market Size and Forecast, By Region, 2021 – 2034 (USD Billion & MW)
- 8.1 Key trends
- 8.2 North America
- 8.2.1 U.S.
- 8.2.2 Canada
- 8.2.3 Mexico
- 8.3 Europe
- 8.3.1 UK
- 8.3.2 France
- 8.3.3 Netherlands
- 8.3.4 Germany
- 8.3.5 Sweden
- 8.3.6 Spain
- 8.3.7 Austria
- 8.4 Asia Pacific
- 8.4.1 China
- 8.4.2 Japan
- 8.4.3 South Korea
- 8.4.4 India
- 8.4.5 Australia
- 8.4.6 Indonesia
- 8.4.7 Malaysia
- 8.4.8 Singapore
- 8.4.9 Thailand
- 8.4.10 New Zealand
- 8.4.11 Philippines
- 8.4.12 Vietnam
- 8.5 Middle East
- 8.5.1 Saudi Arabia
- 8.5.2 UAE
- 8.5.3 Jordan
- 8.5.4 Israel
- 8.6 Africa
- 8.6.1 South Africa
- 8.6.2 Egypt
- 8.6.3 Algeria
- 8.6.4 Nigeria
- 8.6.5 Morocco
- 8.7 Latin America
- 8.7.1 Brazil
- 8.7.2 Chile
Chapter 9 Company Profiles
- 9.1 ArcelorMittal
- 9.2 Array Technologies
- 9.3 Arctech
- 9.4 All Earth Renewables
- 9.5 Convert Italia
- 9.6 Degerenergie
- 9.7 GameChange Solar
- 9.8 Gonvarri Solar Steel
- 9.9 Haosolar
- 9.10 Ideematec
- 9.11 Mecasolar
- 9.12 Nclave
- 9.13 Nextracker
- 9.14 Powerway Renewable Energy
- 9.15 PVHardware
- 9.16 Scorpius Trackers
- 9.17 SmartTrak Solar Systems
- 9.18 Soltec
- 9.19 STI Norland
- 9.20 SunPower Corporation
- 9.21 Trina Solar

