
|
市場調査レポート
商品コード
1859025
浮体式太陽光発電の市場機会、成長促進要因、産業動向分析、2025年~2034年予測Floating Solar PV Market Opportunity, Growth Drivers, Industry Trend Analysis, and Forecast 2025 - 2034 |
||||||
カスタマイズ可能
|
|||||||
| 浮体式太陽光発電の市場機会、成長促進要因、産業動向分析、2025年~2034年予測 |
|
出版日: 2025年10月08日
発行: Global Market Insights Inc.
ページ情報: 英文 120 Pages
納期: 2~3営業日
|

概要
世界の浮体式太陽光発電市場は、2024年には77億米ドルと評価され、CAGR 1.5%で成長し、2034年には89億米ドルに達すると推定されています。
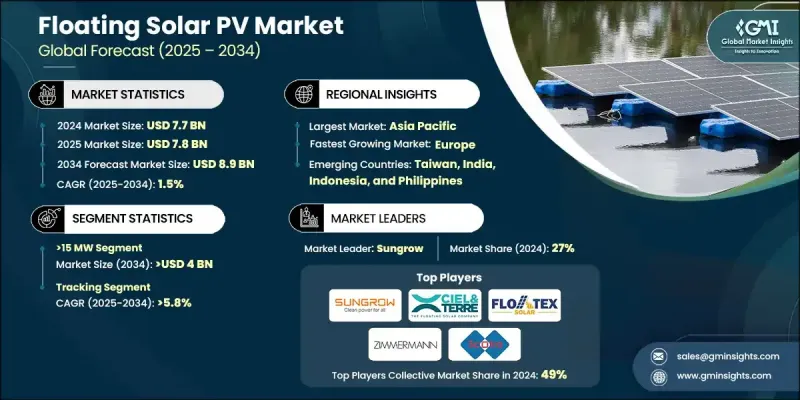
着実な成長の背景には、湖、貯水池、沿岸地帯など、土地の利用が制限される水域でのソーラーパネルの導入が増加していることがあります。浮体式ソーラー・システムは、再生可能エネルギーの生産と、特に暑く乾燥した気候では蒸発を抑えることによる水の保全という2つのメリットをもたらします。中東やアフリカなどの地域では気温が上昇し、淡水資源が限られているため、こうした設備に対する需要が高まっています。政府主導の再生可能エネルギー戦略と、浮体構造、固定技術、耐紫外線性HDPEなどの材料における継続的な進歩が相まって、長期的な普及を支え続けています。浮体式ソーラーを既存の水力発電インフラや水処理施設と統合しようという動きも、新たな成長機会を生み出しています。東南アジアや欧州沿岸部など、土地は限られているが水域が豊富な地域では、浮体式ソーラーが実行可能で拡張性のあるソリューションになりつつあります。エネルギー追跡システムの革新と、高効率の分散型アプリケーションへの関心が、市場の長期的見通しをさらに強めています。
| 市場規模 | |
|---|---|
| 開始年 | 2024 |
| 予測年 | 2025-2034 |
| 市場規模 | 77億米ドル |
| 予測金額 | 89億米ドル |
| CAGR | 1.5% |
容量5MWのシステム分野は、小規模分散型設備との適合性により、2034年までCAGR 2%で成長すると予想されます。これらのモジュール式ソリューションは、農業用池、貯水池、廃水処理プラントなどの施設に最適です。東南アジアの国々は、クリーンエネルギーの移行を支援する内陸水域の利用可能性を活用して、これらのシステムを広く採用しています。
追尾技術分野は、2034年までCAGR 5.8%で成長すると予測されています。これらのシステムは、パネルの向きをリアルタイムで調整することで太陽エネルギーの取り込みを最適化し、出力を大幅に向上させるように設計されています。ポルトガルやスペインのような地域では、土地利用を守りながらエネルギー収量を向上させる広範なイニシアチブの一環として、追尾型導入の先陣を切っています。継続的な技術向上により、追尾機能は浮体式設備との相性がよくなっており、スペースに制約のある地域でも水に恵まれた地域でも効率が向上しています。
米国浮体式太陽光発電2024年の市場規模は1,600万米ドル。カリフォルニア州やニュージャージー州などの州は、政策的インセンティブや州全体の持続可能性プログラムへの統合を通じて、浮体式ソーラー発電の採用を奨励しています。Sungrowのような企業は、積雪地域向けの性能調整など、北米の気象条件に合わせた太陽電池モジュールを設計しています。
世界の浮体式太陽光発電業界の主要企業には、シャープ、インテック・クリーン・エナジー、ソーラーデッキ、ロンギ・ソーラー、アモイ・ソーラー・テック、スイムソル、サングロー・グループ、ツィメルマンPV、シエル・アンド・テール・インターナショナル、インリー・ソーラー、エニ・エナジー・ソリューションズ、オーシャン・サン、フロートレックス・ソーラー、ジンコ・ソーラー、京セラ、ヴィクラム・ソーラー、スコトラ、ファースト・ソーラー、中国三峡新能源、スタットクラフトなどがあります。浮体式太陽光発電市場の企業は、市場での地位を強化するために、製品の革新、ローカライゼーション、戦略的パートナーシップに焦点を当てた戦略を積極的に採用しています。多くの企業が研究開発に投資し、特に海洋や淡水の厳しい環境に対応する浮体式プラットフォームの耐久性と効率を高めています。地域特有の規制や気候の要件を満たすために、個別の設計アプローチが実施されています。
よくあるご質問
目次
第1章 調査手法と範囲
第2章 エグゼクティブサマリー
第3章 業界考察
- 業界エコシステム
- 規制情勢
- 主な浮体式太陽光発電プロジェクト
- 稼働中
- 今後の予定
- 業界への影響要因
- 促進要因
- 業界の潜在的リスク&課題
- 成長可能性分析
- コスト構造分析
- 価格動向分析
- 容量別
- 地域別
- ポーター分析
- PESTEL分析
第4章 競合情勢
- イントロダクション
- 企業の市場シェア分析:地域別
- 北米
- 欧州
- アジア太平洋地域
- 中東・アフリカ
- ラテンアメリカ
- 戦略的ダッシュボード
- 戦略的取り組み
- 企業ベンチマーキング
- イノベーション&テクノロジー情勢
第5章 市場規模・予測:容量別、2021-2034
- 主要動向
- <5 MW
- 5-15 MW
- >15 MW以上
第6章 市場規模・予測:製品別、2021-2034
- 主要動向
- 据置型
- トラッキング
第7章 市場規模・予測:地域別、2021-2034
- 主要動向
- 北米
- 米国
- カナダ
- 欧州
- ドイツ
- フランス
- オランダ
- イタリア
- ノルウェー
- アジア太平洋地域
- 中国
- 日本
- 韓国
- インド
- インドネシア
- 中東・アフリカ
- モロッコ
- アラブ首長国連邦
- ラテンアメリカ
- ブラジル
- ラオス
第8章 企業プロファイル
- Amoy Solar Tech
- China Three Gorges New Energy
- Ciel &Terre International
- Eni Energy Solutions
- First Solar
- Floatex Solar
- Intech Clean Energy
- Jinko Solar
- Kyocera Corporation
- Longi Solar
- Ocean Sun
- Scotra
- SolarDeck
- Sungrow Power Supply
- Statkraft
- Swimsol
- Sharp Corporation
- Vikram Solar
- Yingli Solar
- Zimmermann PV

