
|
市場調査レポート
商品コード
1698530
ボランタリーカーボンクレジット市場の機会、成長促進要因、産業動向分析、2025年~2034年の予測Voluntary Carbon Credit Market Opportunity, Growth Drivers, Industry Trend Analysis, and Forecast 2025-2034 |
||||||
カスタマイズ可能
|
|||||||
| ボランタリーカーボンクレジット市場の機会、成長促進要因、産業動向分析、2025年~2034年の予測 |
|
出版日: 2025年02月06日
発行: Global Market Insights Inc.
ページ情報: 英文 120 Pages
納期: 2~3営業日
|

全表示
- 概要
- 目次
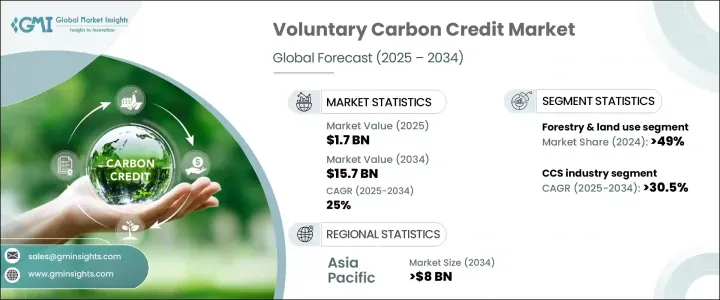
世界のボランタリーカーボンクレジット市場は、2024年に17億米ドルと評価され、2025年から2034年にかけてCAGR 25%で拡大すると予測されています。
ネット・ゼロ・エミッションの達成や持続可能性評価の向上に対する企業のコミットメントの高まりが、さまざまなセクターにわたる多様なクレジット制度の開発を後押ししています。企業は事業活動による排出を相殺するためにカーボンクレジットを積極的に購入しており、市場の成長を後押ししています。ボランタリーカーボンクレジットがコンプライアンスの枠組みに統合されたことで、市場の流動性、信頼性、需要が向上し、価格の安定と企業の参入に貢献する機関投資家が集まっています。この統合により、質の高いプロジェクトへの投資が促進され、カーボンフットプリント削減への世界の取り組みが後押しされ、業界の拡大が加速しています。
現在では、投資家の信頼を高め、企業の評判を向上させるために、ESG戦略にカーボンクレジットを組み込んでいる企業がかなり増えています。ボランタリーカーボンクレジット市場は、2022年の19億米ドルから2024年には17億米ドルに減少したが、業界の予測では、技術の進歩とカーボン・オフセットの計算方法の改善によって力強い回復が見込まれています。アクセシビリティとトレーサビリティを向上させる技術革新は、予測期間中の持続的成長を支えるものと期待されます。
| 市場範囲 | |
|---|---|
| 開始年 | 2024 |
| 予測年 | 2025-2034 |
| 開始金額 | 17億米ドル |
| 予測金額 | 157億米ドル |
| CAGR | 25% |
世界には、企業が自主的に排出量をオフセットし、持続可能性の目標に沿うことを奨励する枠組みがいくつかあります。こうしたガイドラインは説明責任と透明性を重視し、より多くの組織がカーボンクレジット市場に参加するよう促しています。さらに、政府規制以外のさまざまなアプローチが、排出削減プログラムへの自発的な参加を促し、市場のすそ野を広げています。
市場は、林業・土地利用、農業、再生可能エネルギー、炭素回収・貯留、家庭・地域社会、化学プロセス、工業・商業、輸送、廃棄物管理など、最終用途に基づく複数のセグメントに分類されます。2024年には、林業と土地利用が市場シェアの49%以上を占め、今後も成長が見込まれます。世界中で拡大する植林・再植林プロジェクトがカーボンオフセットの需要を高めており、環境政策がこうした取り組みをさらに強化しています。
ボランタリーカーボンクレジット市場における炭素回収・貯留セクターは、2034年までCAGR30.5%を超える成長が見込まれています。炭素緩和への投資の増加と貯留技術の進歩が、この拡大を後押しする主な要因です。再生可能エネルギー分野も、国のエネルギー・ポートフォリオにおける再生可能エネルギー源の割合の増加により、2034年までに30億米ドルを超えると予想されます。世界のエネルギー・ミックスが持続可能な代替エネルギーへとシフトするにつれて、カーボンクレジットの需要も大幅に増加すると予想されます。
米国では、ボランタリーカーボンクレジット市場は2022年の2億米ドルから2024年には4億米ドルに成長しました。ネット・ゼロへのコミットメントの増加と持続可能な製品に対する消費者の嗜好が、企業によるカーボンクレジット・プログラムの採用を促進しています。ブロックチェーン技術に支えられたカーボンクレジット取引の透明性の向上が、市場の信頼を強めています。さらに、直接的な空気回収と炭素除去の取り組みへの投資が技術革新を促進し、ボランタリーカーボンクレジット産業の成長をさらに後押ししています。
目次
第1章 調査手法と調査範囲
- 市場範囲と定義
- 市場推計・予測パラメータ
- 予測計算
- データソース
第2章 エグゼクティブサマリー
第3章 業界洞察
- エコシステム分析
- 規制状況
- 業界への影響要因
- 促進要因
- 業界の潜在的リスク&課題
- 成長ポテンシャル分析
- ポーター分析
- PESTEL分析
第4章 競合情勢
- イントロダクション
- 戦略的展望
- イノベーションと持続可能性の展望
第5章 市場規模・予測:最終用途別、2021年~2034年
- 主要動向
- 農業
- 炭素回収・貯留
- 化学プロセス
- 家庭・コミュニティ
- 工業・商業
- 林業・土地利用
- 再生可能エネルギー
- 廃棄物管理
- その他
第6章 市場規模・予測:地域別、2021年~2034年
- 主要動向
- 北米
- 米国
- カナダ
- メキシコ
- 欧州
- ブルガリア
- ルーマニア
- オランダ
- スイス
- アジア太平洋
- 中国
- インド
- インドネシア
- タイ
- 中東・アフリカ
- トルコ
- ケニア
- ナイジェリア
- 南アフリカ
- ラテンアメリカ
- ブラジル
- チリ
- ペルー
第7章 企業プロファイル
- 3Degrees
- ALLCOT
- Atmosfair
- CarbonClear
- ClimeCo
- Climate Impact Partners
- EcoAct
- Ecosecurities
- Microsoft
- PwC
- Shell
- South Pole
- TerraPass
- The Carbon Collective Company
- The Carbon Trust
- VERRA
The Global Voluntary Carbon Credit Market, valued at USD 1.7 billion in 2024, is projected to expand at a CAGR of 25% from 2025 to 2034. Growing corporate commitments to achieving net-zero emissions and improving sustainability ratings have driven the development of diverse credit systems across different sectors. Companies are actively purchasing carbon credits to offset emissions from business operations, reinforcing market growth. The integration of voluntary carbon credits into compliance frameworks has enhanced market liquidity, credibility, and demand, attracting institutional investors who contribute to price stability and corporate participation. This integration is facilitating increased investment in high-quality projects, boosting global efforts to reduce carbon footprints, and accelerating the industry's expansion.
A significant number of enterprises now incorporate carbon credits into their ESG strategies to strengthen investor confidence and enhance business reputations. While the voluntary carbon credit market saw a decline from USD 1.9 billion in 2022 to USD 1.7 billion in 2024, industry projections indicate a strong rebound driven by technological advancements and improved methods for calculating carbon offsets. Innovations that improve accessibility and traceability are expected to support sustained growth over the forecast period.
| Market Scope | |
|---|---|
| Start Year | 2024 |
| Forecast Year | 2025-2034 |
| Start Value | $1.7 Billion |
| Forecast Value | $15.7 Billion |
| CAGR | 25% |
Several frameworks worldwide encourage businesses to voluntarily offset emissions and align with sustainability objectives. These guidelines emphasize accountability and transparency, prompting more organizations to engage in carbon credit markets. Additionally, various approaches outside government regulations are promoting voluntary participation in emissions reduction programs, expanding the market's scope.
The market is categorized into multiple segments based on end use, including forestry and land use, agriculture, renewable energy, carbon capture and storage, household and community, chemical processes, industrial and commercial, transportation, and waste management. In 2024, forestry and land use accounted for more than 49% of the market share, with expectations of continued growth. Expanding afforestation and reforestation projects worldwide have increased the demand for carbon offsets, with environmental policies further reinforcing these initiatives.
The carbon capture and storage sector within the voluntary carbon credit market is anticipated to grow at a CAGR exceeding 30.5% through 2034. Rising investments in carbon mitigation and advancements in storage technologies are key factors fueling this expansion. The renewable energy sector is also expected to surpass USD 3 billion by 2034, driven by the growing share of renewable sources in national energy portfolios. As the global energy mix shifts toward sustainable alternatives, the demand for carbon credits is expected to rise significantly.
In the United States, the voluntary carbon credit market grew from USD 200 million in 2022 to USD 400 million in 2024. Increasing net-zero commitments and consumer preference for sustainable products are driving corporate adoption of carbon credit programs. Enhanced transparency in carbon credit trading, supported by blockchain technology, has strengthened trust in the market. Additionally, investments in direct air capture and carbon removal initiatives are fostering innovation, further supporting the voluntary carbon credit industry's growth.
Table of Contents
Chapter 1 Methodology & Scope
- 1.1 Market scope & definitions
- 1.2 Market estimates & forecast parameters
- 1.3 Forecast calculation
- 1.4 Data sources
- 1.4.1 Primary
- 1.4.2 Secondary
- 1.4.2.1 Paid
- 1.4.2.2 Public
Chapter 2 Executive Summary
- 2.1 Industry synopsis, 2021 - 2034
Chapter 3 Industry Insights
- 3.1 Industry ecosystem analysis
- 3.2 Regulatory landscape
- 3.3 Industry impact forces
- 3.3.1 Growth drivers
- 3.3.2 Industry pitfalls & challenges
- 3.4 Growth potential analysis
- 3.5 Porter's analysis
- 3.5.1 Bargaining power of suppliers
- 3.5.2 Bargaining power of buyers
- 3.5.3 Threat of new entrants
- 3.5.4 Threat of substitutes
- 3.6 PESTEL analysis
Chapter 4 Competitive Landscape, 2024
- 4.1 Introduction
- 4.2 Strategic outlook
- 4.3 Innovation & sustainability landscape
Chapter 5 Market Size and Forecast, By End Use, 2021 – 2034 (Million Credits, USD Billion)
- 5.1 Key trends
- 5.2 Agriculture
- 5.3 Carbon capture & storage
- 5.4 Chemical process
- 5.5 Household & community
- 5.6 Industrial & commercial
- 5.7 Forestry & land use
- 5.8 Renewable energy
- 5.9 Waste management
- 5.10 Others
Chapter 6 Market Size and Forecast, By Region, 2021 – 2034 (Million Credits, USD Billion)
- 6.1 Key trends
- 6.2 North America
- 6.2.1 U.S.
- 6.2.2 Canada
- 6.2.3 Mexico
- 6.3 Europe
- 6.3.1 Bulgaria
- 6.3.2 Romania
- 6.3.3 Netherlands
- 6.3.4 Switzerland
- 6.4 Asia Pacific
- 6.4.1 China
- 6.4.2 India
- 6.4.3 Indonesia
- 6.4.4 Thailand
- 6.5 Middle East & Africa
- 6.5.1 Turkey
- 6.5.2 Kenya
- 6.5.3 Nigeria
- 6.5.4 South Africa
- 6.6 Latin America
- 6.6.1 Brazil
- 6.6.2 Chile
- 6.6.3 Peru
Chapter 7 Company Profiles
- 7.1 3Degrees
- 7.2 ALLCOT
- 7.3 Atmosfair
- 7.4 CarbonClear
- 7.5 ClimeCo
- 7.6 Climate Impact Partners
- 7.7 EcoAct
- 7.8 Ecosecurities
- 7.9 Microsoft
- 7.10 PwC
- 7.11 Shell
- 7.12 South Pole
- 7.13 TerraPass
- 7.14 The Carbon Collective Company
- 7.15 The Carbon Trust
- 7.16 VERRA
