|
|
市場調査レポート
商品コード
1685080
パワーコンディショナー市場の機会、成長促進要因、産業動向分析、2025年~2034年の予測Power Conditioner Market Opportunity, Growth Drivers, Industry Trend Analysis, and Forecast 2025 - 2034 |
||||||
|
|||||||
カスタマイズ可能
|
|||||||

| パワーコンディショナー市場の機会、成長促進要因、産業動向分析、2025年~2034年の予測 |
|
出版日: 2025年01月02日
発行: Global Market Insights Inc.
ページ情報: 英文 135 Pages
納期: 2~3営業日
|

全表示
- 概要
- 目次
パワーコンディショナーの世界市場は2024年に169億米ドルに達し、2025年から2034年にかけて5.1%のCAGRで安定成長すると予測されています。
市場拡大の原動力となっているのは、高感度電子機器への依存度の高まりと、さまざまな産業におけるクリーンで安定した電力に対する需要の高まりです。企業や家庭が先端技術や高性能デバイスの統合を続ける中、安定した電力供給を維持することが最重要課題となっています。さらに、産業部門の開発とインフラ整備への多額の投資が、パワー・コンディショニング・ソリューションの普及に拍車をかけています。産業界が重要な業務を保護し、ダウンタイムを最小限に抑え、エネルギー使用を最適化しようとしているため、こうした動向はさらに強まると予想されます。
定格容量10kVA超~50kVAのパワーコンディショナー分野は、2034年までに55億米ドルを生み出すと予測されています。この成長は、電力品質管理を強化するスマートグリッドソリューションなどのデジタル技術の進歩によって推進されています。これらの技術革新はリアルタイムの監視と制御を提供し、高感度な電子システムにシームレスな電力供給を保証します。モノのインターネット(IoT)とデータ分析の統合は、電力管理をさらに改善し、電力要件の予測と調整を容易にしました。自動化されたデジタル駆動システムを採用する産業が増えるにつれて、安定した高品質の電力に対する需要がさらに重要になり、この市場セグメントの成長を牽引しています。
| 市場範囲 | |
|---|---|
| 開始年 | 2024 |
| 予測年 | 2025-2034 |
| 開始金額 | 169億米ドル |
| 予測金額 | 276億米ドル |
| CAGR | 5.1% |
パワーコンディショナー市場における可変サイクル・レギュレータ分野は、2034年までCAGR 5%で拡大する見込みです。このセグメントの成長は、データセンターの急速な拡大やIT・通信業界の継続的な進歩と密接に結びついています。無停電電源に大きく依存するこれらの分野は、パワーコンディショナーに対する強い需要を生み出しています。さらに、持続可能性と再生可能エネルギー源を重視する世界の高まりが、このセグメントの可能性をさらに高めています。可変サイクル・レギュレータは、断続的な再生可能エネルギー源であっても安定した電力品質を確保するため、運用効率を損なうことなく環境に優しいエネルギー・ソリューションへの移行を目指す産業にとって極めて重要です。
米国では、パワーコンディショナー市場は2034年までに30億米ドルを生み出すと予想されています。産業および商業部門は、機械や重要なプロセスのための高品質電力に大きく依存しています。パワーコンディショナーは、信頼性の高い電力供給を確保し、機器を保護し、コストのかかるダウンタイムを最小限に抑えるために、これらの分野で不可欠です。より多くの企業や産業が持続可能なエネルギー・システムにシフトするにつれ、再生可能エネルギーの統合と信頼性の高い電力供給をサポートするパワーコンディショナーへの需要が急速に高まっています。このような開発は、特に米国のようなインフラと技術導入が速いペースで進み続ける市場開拓において、進化するエネルギー情勢を支えるパワーコンディショナーの重要な役割を浮き彫りにしています。
目次
第1章 調査手法と調査範囲
- 市場範囲と定義
- 市場推計・予測パラメータ
- 予測計算
- データソース
第2章 エグゼクティブサマリー
第3章 業界洞察
- エコシステム分析
- 規制状況
- 業界への影響要因
- 促進要因
- 業界の潜在的リスク&課題
- 成長ポテンシャル分析
- ポーター分析
- PESTEL分析
第4章 競合情勢
- イントロダクション
- 戦略的展望
- イノベーションと持続可能性の展望
第5章 市場規模・予測:定格出力別、2021年~2034年
- 主要動向
- ≤10 kVA以下
- >10 kVA-50 kVA
- >50 kVA-150 kVA
- >150 kVA
第6章 市場規模・予測:製品別、2021年~2034年
- 主要動向
- 固定サイクルレギュレーター
- 可変サイクルレギュレータ
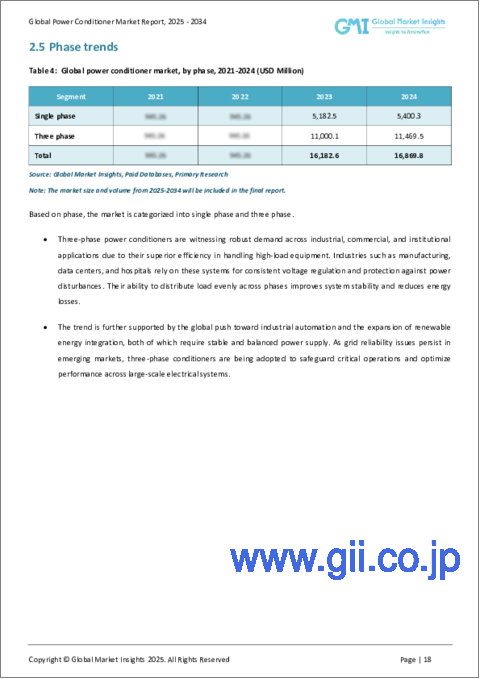
第7章 市場規模・予測:フェーズ別、2021年~2034年
- 主要動向
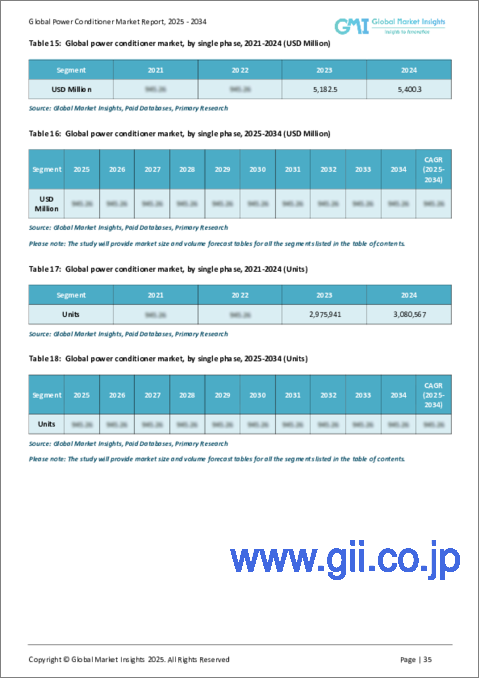
- 単相
- 三相
第8章 市場規模・予測:用途別、2021年~2034年
- 主要動向
- 住宅用
- 商業用
- 産業用
第9章 市場規模・予測:地域別、2021年~2034年
- 主要動向
- 北米
- 米国
- カナダ
- メキシコ
- 欧州
- ドイツ
- フランス
- ロシア
- 英国
- イタリア
- スペイン
- オランダ
- オーストリア
- アジア太平洋
- 中国
- 日本
- 韓国
- インド
- オーストラリア
- ニュージーランド
- インドネシア
- 中東・アフリカ
- サウジアラビア
- アラブ首長国連邦
- カタール
- エジプト
- 南アフリカ
- ナイジェリア
- ラテンアメリカ
- ブラジル
- アルゼンチン
第10章 企業プロファイル
- ABB
- AMETEK
- Delta Electronics
- Eaton
- Emerson Electric
- Farmax Technologies
- Fuji Electric
- Hubbell
- Legrand
- Mitsubishi Electric Corporation
- Panasonic Industry
- Schneider Electric
- SERVOMAX
- Sharp Corporation
- SOLAHD
- Sollatek
- SPECTRUMSTAB INDIA
- Static Power
- Superior Electric
- Unico
- Utility Systems Technologies
- Vishay
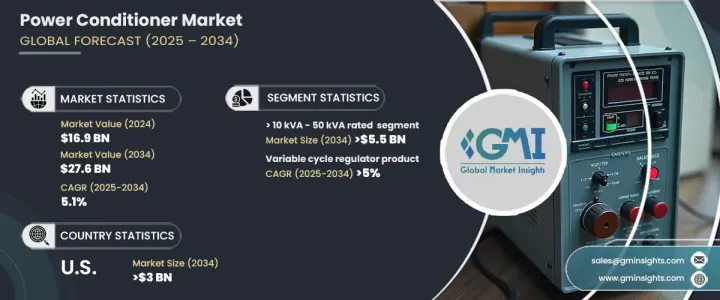
The Global Power Conditioner Market reached USD 16.9 billion in 2024 and is forecasted to grow at a steady CAGR of 5.1% between 2025 and 2034. The market expansion is driven by an increasing reliance on sensitive electronic equipment and the rising demand for clean, stable power across various industries. As businesses and households continue to integrate advanced technologies and high-performance devices, maintaining a consistent power supply has become a top priority. Moreover, the growing industrial sectors, combined with substantial investments in infrastructure development, are fueling the widespread adoption of power conditioning solutions. These trends are expected to intensify as industries seek to safeguard critical operations, minimize downtime, and optimize energy use.
The >10 kVA - 50 kVA rated power conditioner segment is projected to generate USD 5.5 billion by 2034. This growth is being propelled by advancements in digital technologies, including smart grid solutions, that enhance power quality management. These innovations offer real-time monitoring and control, ensuring a seamless power supply for sensitive electronic systems. The integration of the Internet of Things (IoT) and data analytics has further improved power management, making it easier to predict and adjust power requirements. As more industries adopt automated and digitally driven systems, the demand for stable, high-quality power becomes even more critical, driving the growth of this market segment.
| Market Scope | |
|---|---|
| Start Year | 2024 |
| Forecast Year | 2025-2034 |
| Start Value | $16.9 Billion |
| Forecast Value | $27.6 Billion |
| CAGR | 5.1% |
The variable cycle regulator segment within the power conditioner market is set to expand at a CAGR of 5% through 2034. The segment growth is closely tied to the rapid expansion of data centers and the continuous advancements in the IT and telecommunications industries. These sectors, heavily reliant on uninterrupted power, are creating a strong demand for power conditioners. Additionally, the growing global emphasis on sustainability and renewable energy sources is further boosting this segment's potential. Variable cycle regulators ensure consistent power quality, even from intermittent renewable energy sources, making them crucial for industries looking to transition to greener energy solutions without compromising operational efficiency.
In the U.S., the power conditioner market is expected to generate USD 3 billion by 2034. The industrial and commercial sectors depend significantly on high-quality power for machinery and critical processes. Power conditioners are essential in these sectors to ensure reliable power delivery, protect equipment, and minimize costly downtimes. As more businesses and industries shift toward sustainable energy systems, the demand for power conditioners that support renewable energy integration and reliable power supply is rapidly increasing. These developments highlight the vital role of power conditioners in supporting the evolving energy landscape, particularly in markets like the U.S., where infrastructure and technological adoption continue to advance at a fast pace.
Table of Contents
Chapter 1 Methodology & Scope
- 1.1 Market scope & definitions
- 1.2 Market estimates & forecast parameters
- 1.3 Forecast calculation
- 1.4 Data sources
- 1.4.1 Primary
- 1.4.2 Secondary
- 1.4.2.1 Paid
- 1.4.2.2 Public
Chapter 2 Executive Summary
- 2.1 Industry synopsis, 2021 - 2034
Chapter 3 Industry Insights
- 3.1 Industry ecosystem analysis
- 3.2 Regulatory landscape
- 3.3 Industry impact forces
- 3.3.1 Growth drivers
- 3.3.2 Industry pitfalls & challenges
- 3.4 Growth potential analysis
- 3.5 Porter's analysis
- 3.5.1 Bargaining power of suppliers
- 3.5.2 Bargaining power of buyers
- 3.5.3 Threat of new entrants
- 3.5.4 Threat of substitutes
- 3.6 PESTEL analysis
Chapter 4 Competitive Landscape, 2024
- 4.1 Introduction
- 4.2 Strategic outlook
- 4.3 Innovation & sustainability landscape
Chapter 5 Market Size and Forecast, By Power Rating, 2021 – 2034 (Units & USD Million)
- 5.1 Key trends
- 5.2 ≤ 10 kVA
- 5.3 > 10 kVA - 50 kVA
- 5.4 > 50 kVA - 150 kVA
- 5.5 > 150 kVA
Chapter 6 Market Size and Forecast, By Product, 2021 – 2034 (Units & USD Million)
- 6.1 Key trends
- 6.2 Fixed cycle regulator
- 6.3 Variable cycle regulator
Chapter 7 Market Size and Forecast, By Phase, 2021 – 2034 (Units & USD Million)
- 7.1 Key trends
- 7.2 Single phase
- 7.3 Three phase
Chapter 8 Market Size and Forecast, By Application, 2021 – 2034 (Units & USD Million)
- 8.1 Key trends
- 8.2 Residential
- 8.3 Commercial
- 8.4 Industrial
Chapter 9 Market Size and Forecast, By Region, 2021 – 2034 (Units & USD Million)
- 9.1 Key trends
- 9.2 North America
- 9.2.1 U.S.
- 9.2.2 Canada
- 9.2.3 Mexico
- 9.3 Europe
- 9.3.1 Germany
- 9.3.2 France
- 9.3.3 Russia
- 9.3.4 UK
- 9.3.5 Italy
- 9.3.6 Spain
- 9.3.7 Netherlands
- 9.3.8 Austria
- 9.4 Asia Pacific
- 9.4.1 China
- 9.4.2 Japan
- 9.4.3 South Korea
- 9.4.4 India
- 9.4.5 Australia
- 9.4.6 New Zealand
- 9.4.7 Indonesia
- 9.5 Middle East & Africa
- 9.5.1 Saudi Arabia
- 9.5.2 UAE
- 9.5.3 Qatar
- 9.5.4 Egypt
- 9.5.5 South Africa
- 9.5.6 Nigeria
- 9.6 Latin America
- 9.6.1 Brazil
- 9.6.2 Argentina
Chapter 10 Company Profiles
- 10.1 ABB
- 10.2 AMETEK
- 10.3 Delta Electronics
- 10.4 Eaton
- 10.5 Emerson Electric
- 10.6 Farmax Technologies
- 10.7 Fuji Electric
- 10.8 Hubbell
- 10.9 Legrand
- 10.10 Mitsubishi Electric Corporation
- 10.11 Panasonic Industry
- 10.12 Schneider Electric
- 10.13 SERVOMAX
- 10.14 Sharp Corporation
- 10.15 SOLAHD
- 10.16 Sollatek
- 10.17 SPECTRUMSTAB INDIA
- 10.18 Static Power
- 10.19 Superior Electric
- 10.20 Unico
- 10.21 Utility Systems Technologies
- 10.22 Vishay
