
|
市場調査レポート
商品コード
1667154
LoRaWANの市場機会、成長促進要因、産業動向分析、2025~2034年予測LoRaWAN Market Opportunity, Growth Drivers, Industry Trend Analysis, and Forecast 2025 - 2034 |
||||||
カスタマイズ可能
|
|||||||
| LoRaWANの市場機会、成長促進要因、産業動向分析、2025~2034年予測 |
|
出版日: 2024年12月06日
発行: Global Market Insights Inc.
ページ情報: 英文 350 Pages
納期: 2~3営業日
|

全表示
- 概要
- 目次
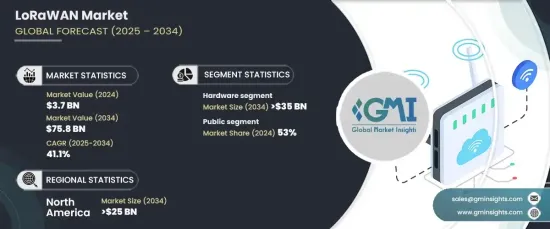
LoRaWANの世界市場は、2024年に37億米ドルと評価され、2025年から2034年にかけて41.1%の驚異的なCAGRで成長すると予測されています。
この成長には、交通、通信、エネルギー、安全、廃棄物管理システムの高度化に焦点を当てたスマートシティ構想への投資の増加が寄与しています。これらの都市開発における効率的な高速通信の必要性は、市場拡大の重要な要因です。
LoRaWAN技術の採用が増加しているのは、媒体アクセス制御(MAC)プロトコルによって長距離通信をサポートする能力があるためです。さらに、そのコスト効率とエネルギー効率の高い無線ネットワークは、持続可能なモノのインターネット(IoT)ソリューションの需要に対応しています。また企業は、人工知能や機械学習などの高度なデジタルツールをLoRaWAN対応ネットワークに統合することで、多様な業界の業務効率とリアルタイムのアプリケーションパフォーマンスを強化しています。
| 市場範囲 | |
|---|---|
| 開始年 | 2024年 |
| 予測年 | 2025~2034年 |
| 開始金額 | 37億米ドル |
| 予測金額 | 758億米ドル |
| CAGR | 41.1% |
インダストリー4.0の動向はこの勢いを増幅しており、相互接続されたデバイス間の戦略的ネットワーキングを活用して、低消費電力の広域ネットワーク上でプロセスを合理化しています。製造業やその他の産業でデジタル化が重視されるようになり、LoRaWANベースのソリューションの採用が進んでいます。BluetoothやZigbeeのような従来の無線技術とは異なり、LoRaWANデバイスは優れた長距離接続性を提供し、広域通信の理想的なソリューションとして位置付けられています。
コンポーネント別に見ると、市場はハードウェア、ソフトウェア、サービスに分類されます。ハードウェアは2024年に最大のシェアを占め、市場に45%以上貢献しています。IoT対応デバイスの需要増加とセンサー技術の進歩がこの分野を牽引しており、2034年には350億米ドルを超えると予測されています。センサー、ゲートウェイ、モジュールなどのトランスミッションは、効率的なデータ伝送を促進し、ネットワークカバレッジを強化する上で不可欠です。
展開モデル別では、パブリックネットワークが2024年の市場シェアの53%を占めています。これらのネットワークは、その拡張性とコスト優位性から、特に広範なカバレッジを必要とするIoTアプリケーションに広く好まれています。通信事業者の支援や、エネルギー効率の高い通信ソリューションを推進する政府の取り組みが、普及をさらに後押ししています。
地域別では、北米が2024年に30%を超えるシェアで市場をリードし、2034年には250億米ドルに達すると予測されています。米国は、広範なIoTインフラ投資と低消費電力でエネルギー効率の高い技術への注力により、引き続き主要な貢献国となっています。IoTイノベーションに対する政府の強力な支援は、業界を問わず市場の成長を推進し続けています。
目次
第1章 調査手法と調査範囲
- 調査デザイン
- 調査アプローチ
- データ収集方法
- 基本推定と計算
- 基準年の算出
- 市場推計の主要動向
- 予測モデル
- 1次調査と検証
- 1次情報
- データマイニングソース
- 市場定義
第2章 エグゼクティブサマリー
第3章 業界洞察
- エコシステム分析
- サプライヤーの状況
- チップセットメーカー
- モジュールメーカー
- デバイスメーカー
- ネットワーク事業者
- ソリューションプロバイダー
- エンドユーザー
- 利益率分析
- LoRaWANと他のIoTプロトコル(NB-IoT、Sigfoxなど)の比較
- LoRAWAN加入者数
- イノベーションと技術展望
- 主要ニュースとイニシアチブ
- 規制状況
- 影響要因
- 促進要因
- スマートシティへの投資の増加
- インダストリー4.0の普及拡大
- 長距離無線接続に対する世界的な需要の高まり
- 製造業におけるLoRaゲートウェイとセンサーの採用拡大
- 資産管理とスマート廃棄物管理におけるLoRaWANの採用拡大
- 業界の潜在的リスク&課題
- データセキュリティに関する懸念の高まり
- ネットワークカバレッジと品質
- 促進要因
- 成長可能性分析
- ポーター分析
- PESTEL分析
第4章 競合情勢
- イントロダクション
- 企業シェア分析
- 競合のポジショニングマトリックス
- 戦略展望マトリックス
第5章 市場推計・予測:コンポーネント別、2021~2034年
- 主要動向
- ハードウェア
- エンドノード
- ゲートウェイ
- モジュール
- ソフトウェア
- サービス
- 統合
- メンテナンス
- トレーニングとコンサルティング
第6章 市場推計・予測:展開モデル別、2021~2034年
- 主要動向
- プライベート
- パブリック
- ハイブリッド
第7章 市場推計・予測:用途別、2021~2034年
- 主要動向
- スマートガスと水道メーター
- 資産追跡
- スマートビルディング
- スマートパーキング
- 精密農業
- スマート廃棄物管理
- 家畜モニタリング
- その他
第8章 市場推計・予測:最終用途別、2021~2034年
- 主要動向
- ヘルスケア
- 農業
- 物流・輸送
- 製造業
- 公益事業
- 家電
- 政府・公共部門
- その他
第9章 市場推計・予測:地域別、2021~2034年
- 主要動向
- 北米
- 米国
- カナダ
- 欧州
- 英国
- ドイツ
- フランス
- スペイン
- イタリア
- ロシア
- 北欧
- アジア太平洋
- 中国
- インド
- 日本
- 韓国
- ニュージーランド
- 東南アジア
- ラテンアメリカ
- ブラジル
- メキシコ
- アルゼンチン
- 中東・アフリカ
- UAE
- 南アフリカ
- サウジアラビア
第10章 企業プロファイル
- A2A Smart City
- Actility
- Adeunis
- Cisco System
- Everynet
- Helium
- Kerlink
- Kontron AG
- KPN
- LORIOT AG
- Meshed
- Microchip Technology
- National Narrowband Network Co.(NNNCo.)
- Orange
- OrbiWise
- Senet
- SMtech
- Swisscom AG
- TEKTELIC Communications
- Worldsensing
The Global LoRaWAN Market, valued at USD 3.7 billion in 2024, is anticipated to grow at an impressive CAGR of 41.1% from 2025 to 2034. This growth is fueled by increasing investments in smart city initiatives focused on advancing transportation, communication, energy, safety, and waste management systems. The need for efficient, high-speed communication in these urban developments is a critical driver of market expansion.
The adoption of LoRaWAN technology is rising due to its ability to support long-range communication through the Medium Access Control (MAC) protocol. In addition, its cost-effective and energy-efficient wireless networks address the demand for sustainable Internet of Things (IoT) solutions. Businesses are also integrating advanced digital tools such as artificial intelligence and machine learning into LoRaWAN-enabled networks to enhance operational efficiencies and real-time application performance across diverse industries.
| Market Scope | |
|---|---|
| Start Year | 2024 |
| Forecast Year | 2025-2034 |
| Start Value | $3.7 Billion |
| Forecast Value | $75.8 Billion |
| CAGR | 41.1% |
Industry 4.0 trends are amplifying this momentum, leveraging strategic networking among interconnected devices to streamline processes over low-power, wide-area networks. The growing emphasis on digitalization in manufacturing and other industries enhances the adoption of LoRaWAN-based solutions, which optimize production efficiency and quality while enabling seamless machine-to-machine communication. Unlike traditional wireless technologies like Bluetooth or Zigbee, LoRaWAN devices provide superior long-range connectivity, positioning them as the ideal solution for wide-area communications.
By component, the market is categorized into hardware, software, and services. Hardware held the largest share in 2024, contributing over 45% to the market. The increasing demand for IoT-enabled devices and advancements in sensor technology are driving this segment, which is forecasted to surpass USD 35 billion by 2034. Components like sensors, gateways, and modules are vital in facilitating efficient data transmission and enhancing network coverage.
In terms of deployment, public networks accounted for 53% of the market share in 2024. These networks are widely preferred for their scalability and cost advantages, particularly for IoT applications requiring broad coverage. Support from telecom operators and government initiatives promoting energy-efficient communication solutions further drives adoption.
Regionally, North America led the market with a share exceeding 30% in 2024 and is projected to reach USD 25 billion by 2034. The U.S. remains a key contributor, driven by extensive IoT infrastructure investments and a focus on low-power, energy-efficient technologies. Strong government support for IoT innovation continues to propel the market's growth across industries.
Table of Contents
Chapter 1 Methodology & Scope
- 1.1 Research design
- 1.1.1 Research approach
- 1.1.2 Data collection methods
- 1.2 Base estimates and calculations
- 1.2.1 Base year calculation
- 1.2.2 Key trends for market estimates
- 1.3 Forecast model
- 1.4 Primary research & validation
- 1.4.1 Primary sources
- 1.4.2 Data mining sources
- 1.5 Market definition
Chapter 2 Executive Summary
- 2.1 Industry 3600 synopsis, 2021 - 2034
Chapter 3 Industry Insights
- 3.1 Industry ecosystem analysis
- 3.2 Supplier landscape
- 3.2.1 Chipset manufacturers
- 3.2.2 Module manufacturers
- 3.2.3 Device manufacturers
- 3.2.4 Network operators
- 3.2.5 Solution providers
- 3.2.6 End Use
- 3.3 Profit margin analysis
- 3.4 Comparison of LoRaWAN with other IoT protocols (e.g., NB-IoT, Sigfox)
- 3.5 LoRAWAN subscribers
- 3.5.1 North America
- 3.5.2 Europe
- 3.5.3 Asia Pacific
- 3.5.4 Latin America
- 3.5.5 MEA
- 3.6 Technology & innovation landscape
- 3.7 Key news & initiatives
- 3.8 Regulatory landscape
- 3.9 Impact forces
- 3.9.1 Growth drivers
- 3.9.1.1 Increasing investments toward smart cities
- 3.9.1.2 Increasing penetration of Industry 4.0
- 3.9.1.3 Increasing demand for long-range wireless connectivity around the world
- 3.9.1.4 The growing adoption of LoRa gateways and sensors in the manufacturing industry
- 3.9.1.5 Growing adoption of LoRaWAN in asset management and smart waste management
- 3.9.2 Industry pitfalls & challenges
- 3.9.2.1 Increasing concerns related to data security
- 3.9.2.2 Network coverage and quality
- 3.9.1 Growth drivers
- 3.10 Growth potential analysis
- 3.11 Porter’s analysis
- 3.12 PESTEL analysis
Chapter 4 Competitive Landscape, 2024
- 4.1 Introduction
- 4.2 Company market share analysis
- 4.3 Competitive positioning matrix
- 4.4 Strategic outlook matrix
Chapter 5 Market Estimates & Forecast, By Component, 2021 - 2034 ($Bn)
- 5.1 Key trends
- 5.2 Hardware
- 5.2.1 End-node
- 5.2.2 Gateway
- 5.2.3 Module
- 5.3 Software
- 5.4 Services
- 5.4.1 Integration
- 5.4.2 Maintenance
- 5.4.3 Training and consulting
Chapter 6 Market Estimates & Forecast, By Deployment Model, 2021 - 2034 ($Bn)
- 6.1 Key trends
- 6.2 Private
- 6.3 Public
- 6.4 Hybrid
Chapter 7 Market Estimates & Forecast, By Application, 2021 - 2034 ($Bn)
- 7.1 Key trends
- 7.2 Smart gas and water metering
- 7.3 Asset tracking
- 7.4 Smart buildings
- 7.5 Smart parking
- 7.6 Precision agriculture
- 7.7 Smart waste management
- 7.8 Livestock monitoring
- 7.9 Others
Chapter 8 Market Estimates & Forecast, By End Use, 2021 - 2034 ($Bn)
- 8.1 Key trends
- 8.2 Healthcare
- 8.3 Agriculture
- 8.4 Logistics and transportation
- 8.5 Manufacturing
- 8.6 Utilities
- 8.7 Consumer electronics
- 8.8 Government and public sector
- 8.9 Others
Chapter 9 Market Estimates & Forecast, By Region, 2021 - 2034 ($Bn)
- 9.1 Key trends
- 9.2 North America
- 9.2.1 U.S.
- 9.2.2 Canada
- 9.3 Europe
- 9.3.1 UK
- 9.3.2 Germany
- 9.3.3 France
- 9.3.4 Spain
- 9.3.5 Italy
- 9.3.6 Russia
- 9.3.7 Nordics
- 9.4 Asia Pacific
- 9.4.1 China
- 9.4.2 India
- 9.4.3 Japan
- 9.4.4 South Korea
- 9.4.5 ANZ
- 9.4.6 Southeast Asia
- 9.5 Latin America
- 9.5.1 Brazil
- 9.5.2 Mexico
- 9.5.3 Argentina
- 9.6 MEA
- 9.6.1 UAE
- 9.6.2 South Africa
- 9.6.3 Saudi Arabia
Chapter 10 Company Profiles
- 10.1 A2A Smart City
- 10.2 Actility
- 10.3 Adeunis
- 10.4 Cisco System
- 10.5 Everynet
- 10.6 Helium
- 10.7 Kerlink
- 10.8 Kontron AG
- 10.9 KPN
- 10.10 LORIOT AG
- 10.11 Meshed
- 10.12 Microchip Technology
- 10.13 National Narrowband Network Co. (NNNCo.)
- 10.14 Orange
- 10.15 OrbiWise
- 10.16 Senet
- 10.17 SMtech
- 10.18 Swisscom AG
- 10.19 TEKTELIC Communications
- 10.20 Worldsensing
