
|
市場調査レポート
商品コード
1666996
サージ保護デバイス市場の機会、成長促進要因、産業動向分析、2025~2034年の予測Surge Protection Devices Market Opportunity, Growth Drivers, Industry Trend Analysis, and Forecast 2025 - 2034 |
||||||
カスタマイズ可能
|
|||||||
| サージ保護デバイス市場の機会、成長促進要因、産業動向分析、2025~2034年の予測 |
|
出版日: 2024年12月27日
発行: Global Market Insights Inc.
ページ情報: 英文 140 Pages
納期: 2~3営業日
|

全表示
- 概要
- 目次
サージ保護デバイスの世界市場は、2024年に36億米ドルと評価され、世界中の家庭、企業、および産業における電子機器の採用増加により、2025年から2034年にかけてCAGR 6.4%で成長すると予測されています。
サージ・サプレッサやプロテクタとしても知られるサージ保護デバイスは、雷、電気障害、送電網の変動によって発生する突発的な電圧スパイクやサージから、高感度な電気機器を保護するように設計されています。これらのデバイスは、エネルギー管理システムとの統合が進むにつれて、最適な電力品質を維持しながらエネルギー効率を改善するための包括的なソリューションを提供します。
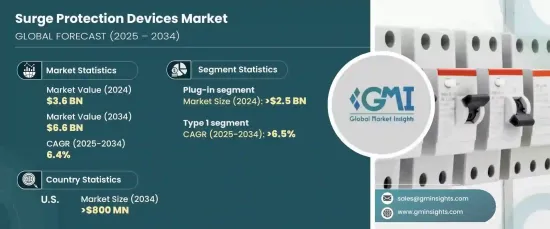
住宅用および商業用用途におけるサージ保護デバイスの需要の高まりは、主に電子機器の使用の増加に起因しています。技術への依存度が高まる中、家庭や企業は、電力サージによる潜在的な損傷からデバイスを保護するための費用対効果が高く信頼性の高いソリューションを求めています。このため、プラグイン・サージ保護デバイスの需要が顕著に増加しており、このセグメントは2034年までに25億米ドルを超えると予想されています。消費者は、より多くの電子機器を採用するにつれて、便利で手頃な価格の保護ソリューションをますます好むようになっています。
| 市場範囲 | |
|---|---|
| 開始年 | 2024 |
| 予測年 | 2025-2034 |
| 開始金額 | 36億米ドル |
| 予測金額 | 66億米ドル |
| CAGR | 6.4% |
タイプ 1サージ保護デバイスは、雷保護の重要性に対する意識の高まりにより、顕著な成長が見込まれます。ビル管理および自動化システムにおけるその役割は、リアルタイムのモニタリングや遠隔制御を強化し、システムの信頼性を向上させることで顕著になりつつあります。この動向は今後も市場を形成し、2034年までのCAGRは6.5%を超えると予測されます。
米国では、規制の強化や環境に優しくコンパクトなオプションを求める消費者の需要に後押しされ、サージ保護デバイス市場は2034年までに8億米ドルを超えると予想されています。サージプロテクタは現在、スマートホームシステムへの統合が進んでおり、住宅所有者は他の接続機器と一緒に管理することで、より合理的な体験をすることができます。
アジア太平洋地域は、クラウド・コンピューティングとデータ集約型用途の拡大によるデータセンター需要の高まりに牽引され、大きな成長を遂げようとしています。電気安全、電圧安定性、サージ保護を取り巻く厳しい政府規制を受けて、サージ保護デバイスの採用が増加しています。さらに、遠隔サージ監視とリアルタイムの電力品質管理を可能にするデバイスへの需要が加速し、この地域の市場成長がさらに強化される見込みです。
目次
第1章 調査手法と調査範囲
- 市場範囲と定義
- 市場推計・予測パラメータ
- 予測計算
- データソース
- 1次データ
- 2次データ
- 有料
- 公的
第2章 エグゼクティブサマリー
第3章 業界洞察
- エコシステム分析
- 規制状況
- 業界への影響要因
- 促進要因
- 業界の潜在的リスク&課題
- 成長可能性分析
- ポーターの分析
- 供給企業の交渉力
- 買い手の交渉力
- 新規参入業者の脅威
- 代替品の脅威
- PESTEL分析
第4章 競合情勢
- イントロダクション
- 戦略的展望
- イノベーションと持続可能性の展望
第5章 市場規模・予測:製品別、2021年~2034年
- 主要動向
- ハードワイヤード
- プラグイン
- ラインコード
- 電源制御機器
第6章 市場規模・予測:技術別、2021年~2034年
- 主要動向
- タイプ 1
- タイプ 2
- タイプ 3
第7章 市場規模・予測:定格電力別、2021年~2034年
- 主要動向
- 50 kA 以下
- 50 KA~100 KA 以上
- 100 KA~150 KA 以上
- 150 KA 以上
第8章 市場規模・予測:用途別、2021年~2034年
- 主要動向
- 住宅用
- 商業用
- 産業用
第9章 市場規模・予測:地域別、2021年~2034年
- 主要動向
- 北米
- 米国
- カナダ
- メキシコ
- 欧州
- ドイツ
- フランス
- ロシア
- 英国
- イタリア
- スペイン
- オランダ
- オーストリア
- アジア太平洋
- 中国
- 日本
- 韓国
- インド
- オーストラリア
- ニュージーランド
- マレーシア
- インドネシア
- 中東・アフリカ
- サウジアラビア
- アラブ首長国連邦
- カタール
- エジプト
- 南アフリカ
- ナイジェリア
- ラテンアメリカ
- ブラジル
- アルゼンチン
第10章 企業プロファイル
- ABB
- Belkin
- Bourns
- CG Power and Industrial Solutions
- Eaton
- Emerson Electric
- General Electric
- Havells India
- Hubbell
- Infineon Technologies
- JMV
- Legrand
- Leviton Manufacturing
- Littelfuse
- Maxivolt
- Mercen
The Global Surge Protection Devices Market, valued at USD 3.6 billion in 2024, is projected to grow at a CAGR of 6.4% from 2025 to 2034, driven by the increasing adoption of electronic devices in homes, businesses, and industries worldwide. Surge protection devices, also known as surge suppressors or protectors, are designed to protect sensitive electrical equipment from sudden voltage spikes or surges, which can occur due to lightning, electrical disturbances, or power grid fluctuations. As these devices are increasingly integrated with energy management systems, they offer a comprehensive solution for improving energy efficiency while maintaining optimal power quality.
The growing demand for surge protection devices in residential and commercial applications is largely attributed to the rising use of electronic appliances. With an increasing reliance on technology, households, and businesses are looking for cost-effective and reliable solutions to protect their devices from potential damage caused by power surges. This has led to a notable rise in demand for plug-in surge protection devices, a segment expected to exceed USD 2.5 billion by 2034. Consumers are increasingly favoring convenient, affordable protection solutions as they adopt more electronic devices.
| Market Scope | |
|---|---|
| Start Year | 2024 |
| Forecast Year | 2025-2034 |
| Start Value | $3.6 Billion |
| Forecast Value | $6.6 Billion |
| CAGR | 6.4% |
Type 1 surge protection devices are anticipated to experience notable growth, driven by heightened awareness of the importance of lightning protection. Their role in building management and automation systems is becoming more prominent, enhancing real-time monitoring and remote control, which improves system reliability. This trend will likely continue to shape the market, with a projected CAGR of over 6.5% through 2034 for these devices.
In the U.S., the surge protection devices market is expected to surpass USD 800 million by 2034, fueled by stricter regulations and consumer demand for eco-friendly, compact options. Surge protectors are now increasingly integrated into smart home systems, allowing homeowners to manage them alongside other connected devices for a more streamlined experience.
The Asia Pacific region is poised for significant growth, driven by the rising demand for data centers fueled by the expansion of cloud computing and data-intensive applications. In response to stringent government regulations surrounding electrical safety, voltage stability, and surge protection, the adoption of surge protection devices is on the rise. Additionally, the demand for devices that enable remote surge monitoring and real-time power quality management is set to accelerate, further strengthening market growth in this region.
Table of Contents
Chapter 1 Methodology & Scope
- 1.1 Market scope & definitions
- 1.2 Market estimates & forecast parameters
- 1.3 Forecast calculation
- 1.4 Data sources
- 1.4.1 Primary
- 1.4.2 Secondary
- 1.4.2.1 Paid
- 1.4.2.2 Public
Chapter 2 Executive Summary
- 2.1 Industry synopsis, 2021 - 2034
Chapter 3 Industry Insights
- 3.1 Industry ecosystem analysis
- 3.2 Regulatory landscape
- 3.3 Industry impact forces
- 3.3.1 Growth drivers
- 3.3.2 Industry pitfalls & challenges
- 3.4 Growth potential analysis
- 3.5 Porter's Analysis
- 3.5.1 Bargaining power of suppliers
- 3.5.2 Bargaining power of buyers
- 3.5.3 Threat of new entrants
- 3.5.4 Threat of substitutes
- 3.6 PESTEL Analysis
Chapter 4 Competitive Landscape, 2024
- 4.1 Introduction
- 4.2 Strategic outlook
- 4.3 Innovation & sustainability landscape
Chapter 5 Market Size and Forecast, By Product, 2021 – 2034 (Units & USD Million)
- 5.1 Key trends
- 5.2 Hard-wired
- 5.3 Plug-in
- 5.4 Line cord
- 5.5 Power control devices
Chapter 6 Market Size and Forecast, By Technology, 2021 – 2034 (Units & USD Million)
- 6.1 Key trends
- 6.2 Type 1
- 6.3 Type 2
- 6.4 Type 3
Chapter 7 Market Size and Forecast, By Power Rating, 2021 – 2034 (Units & USD Million)
- 7.1 Key trends
- 7.2 ≤ 50 kA
- 7.3 > 50 KA to 100 KA
- 7.4 > 100 KA to 150 KA
- 7.5 > 150 KA
Chapter 8 Market Size and Forecast, By Application, 2021 – 2034 (Units & USD Million)
- 8.1 Key trends
- 8.2 Residential
- 8.3 Commercial
- 8.4 Industrial
Chapter 9 Market Size and Forecast, By Region, 2021 – 2034 (Units & USD Million)
- 9.1 Key trends
- 9.2 North America
- 9.2.1 U.S.
- 9.2.2 Canada
- 9.2.3 Mexico
- 9.3 Europe
- 9.3.1 Germany
- 9.3.2 France
- 9.3.3 Russia
- 9.3.4 UK
- 9.3.5 Italy
- 9.3.6 Spain
- 9.3.7 Netherlands
- 9.3.8 Austria
- 9.4 Asia Pacific
- 9.4.1 China
- 9.4.2 Japan
- 9.4.3 South Korea
- 9.4.4 India
- 9.4.5 Australia
- 9.4.6 New Zealand
- 9.4.7 Malaysia
- 9.4.8 Indonesia
- 9.5 Middle East & Africa
- 9.5.1 Saudi Arabia
- 9.5.2 UAE
- 9.5.3 Qatar
- 9.5.4 Egypt
- 9.5.5 South Africa
- 9.5.6 Nigeria
- 9.6 Latin America
- 9.6.1 Brazil
- 9.6.2 Argentina
Chapter 10 Company Profiles
- 10.1 ABB
- 10.2 Belkin
- 10.3 Bourns
- 10.4 CG Power and Industrial Solutions
- 10.5 Eaton
- 10.6 Emerson Electric
- 10.7 General Electric
- 10.8 Havells India
- 10.9 Hubbell
- 10.10 Infineon Technologies
- 10.11 JMV
- 10.12 Legrand
- 10.13 Leviton Manufacturing
- 10.14 Littelfuse
- 10.15 Maxivolt
- 10.16 Mercen

