
|
市場調査レポート
商品コード
1666959
タイヤ熱分解油市場の機会、成長促進要因、産業動向分析、2025~2034年の予測Tire Pyrolysis Oil Market Opportunity, Growth Drivers, Industry Trend Analysis, and Forecast 2025 - 2034 |
||||||
カスタマイズ可能
|
|||||||
| タイヤ熱分解油市場の機会、成長促進要因、産業動向分析、2025~2034年の予測 |
|
出版日: 2024年12月14日
発行: Global Market Insights Inc.
ページ情報: 英文 200 Pages
納期: 2~3営業日
|

全表示
- 概要
- 目次
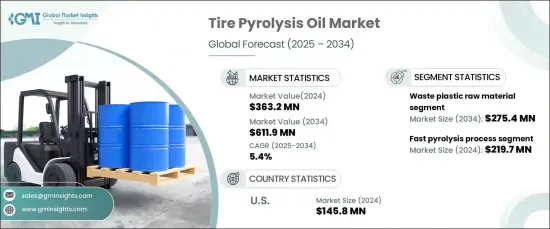
2024年に3億6,320万米ドルと評価された世界のタイヤ熱分解油市場は、2025年から2034年にかけてCAGR 5.4%で拡大すると予測されています。
この成長には、持続可能な代替物に対する需要の増加と、廃棄物管理技術の継続的な進歩が寄与しています。産業界が環境に優しい慣行へとシフトする中、廃棄物の熱分解から得られるタイヤ熱分解油(TPO)は、二酸化炭素排出量を削減し、循環型経済を促進するための実行可能なソリューションとして台頭してきています。世界各国の政府は、埋め立て廃棄物を抑制するために厳しい規制を導入しており、TPOの採用をさらに後押ししています。従来の化石燃料に代わる、費用対効果に優れ、環境に優しいオイルとして、エネルギー、製造、輸送などの産業で広く利用されるようになっています。
廃プラスチックや使用済みタイヤを筆頭とする多様な原料の統合により、市場は力強い成長を遂げています。廃プラスチックは発熱量が高く、TPO生産の主要原料になりつつあります。このセグメントは2034年までに2億7,540万米ドルに達し、CAGR 6.2%の著しい成長が見込まれます。使用済みタイヤは、環境への影響を最小限に抑え、埋立地での非生分解性材料の蓄積を減少させることを目的としたリサイクルの取り組みが広まっていることもあり、依然として主要な原料となっています。さらに、石油汚泥、木材、工業残渣などの原料が熱分解プロセスに組み込まれ、原料の範囲が広がり、生産効率が向上しています。
| 市場範囲 | |
|---|---|
| 開始年 | 2024 |
| 予測年 | 2025-2034 |
| 開始金額 | 3億6,320万米ドル |
| 予測金額 | 6億1,190万米ドル |
| CAGR | 5.4% |
高速熱分解が技術的展望をリードしており、2024年の市場シェアは60.5%、市場規模は2億1,970万米ドルです。より少ないエネルギー消費で高い油収率を効率的に得ることができるため、TPO生産に適した方法として位置づけられています。急速加熱技術を利用するフラッシュ熱分解は、生産物の品質とプロセス効率を最適化するために人気を集めています。一方、低速熱分解は、得られる油量は少ないもの、チャーや鉄鋼などの貴重な製品別を生産し続け、これらは重要な工業用途に使用されています。
米国はタイヤ熱分解油市場の主要プレーヤーとして台頭してきており、2034年にはCAGR 5.1%で1億4,580万米ドルに達すると予想されています。成長の原動力は、厳しい環境規制、リサイクルの義務化、高度な熱分解システムへの投資の増加です。持続可能な技術を促進し、カーボンフットプリントを削減するための政府の奨励策が、様々な分野でのTPOの採用をさらに後押ししています。企業が環境に優しい手法の導入に注力する中、米国市場は世界のタイヤ熱分解油産業における革新と拡大の最前線であり続けると思われます。
目次
第1章 調査手法と調査範囲
- 市場範囲と定義
- 基本推定と計算
- 予測計算
- データソース
- 1次データ
- 2次データ
- 有料情報源
- 公的情報源
第2章 エグゼクティブサマリー
第3章 業界洞察
- エコシステム分析
- バリューチェーンに影響を与える要因
- 利益率分析
- 破壊
- 将来の展望
- メーカー
- 流通業者
- サプライヤーの状況
- 利益率分析
- 主要ニュース
- 規制状況
- 影響要因
- 業界への影響要因
- 促進要因
- 環境への懸念と廃棄物処理問題
- 燃料価格の上昇と経済効果
- 様々な用途における汎用性と適応性
- 市場の課題
- 技術的限界と生産効率
- 促進要因
- 規制と市場への影響
- ポーターの分析
- PESTEL分析
第4章 競合情勢
- イントロダクション
- 企業シェア分析
- 競合のポジショニング・マトリックス
- 戦略展望マトリックス
第5章 市場規模・予測:原料別、2021年~2034年
- 主要動向
- 廃プラスチック
- 廃ゴム
- 木材
- オイルスラッジ
- その他
第6章 市場規模・予測:プロセス別、2021年~2034年
- 主要動向
- 高速熱分解
- フラッシュ熱分解
- 低速熱分解
第7章 市場規模・予測:最終用途別、2021年~2034年
- 主要動向
- 化学品
- 燃料
- その他
第8章 市場規模・予測:地域別、2021年~2034年
- 主要動向
- 北米
- 米国
- カナダ
- 欧州
- 英国
- ドイツ
- フランス
- イタリア
- スペイン
- ロシア
- アジア太平洋
- 中国
- インド
- 日本
- 韓国
- オーストラリア
- ラテンアメリカ
- ブラジル
- メキシコ
- 中東・アフリカ
- 南アフリカ
- サウジアラビア
- アラブ首長国連邦
第9章 企業プロファイル
- Alterra Energy
- Bioenergy Ae Cote-Nord
- Bridgestone Corporation
- Ensyn
- Green Fuel Nordic Oy
- Mk Aromatics Limited
- New Energy Kft.
- New Hope Energy
- Nexus Circular
- Plastic Energy
The Global Tire Pyrolysis Oil Market, valued at USD 363.2 million in 2024, is projected to expand at a CAGR of 5.4% between 2025 and 2034. This growth is fueled by the increasing demand for sustainable alternatives and continuous advancements in waste management technologies. As industries shift toward environmentally friendly practices, tire pyrolysis oil (TPO), derived from the thermal decomposition of waste materials, is emerging as a viable solution for reducing carbon emissions and promoting a circular economy. Governments worldwide are introducing stringent regulations to curb landfill waste, further driving the adoption of TPO. The oil's ability to serve as a cost-effective and eco-friendly substitute for traditional fossil fuels is encouraging its widespread utilization across industries such as energy, manufacturing, and transportation.
The market is experiencing robust growth due to the integration of diverse feedstocks, with waste plastic and end-of-life tires at the forefront. Waste plastic, recognized for its high calorific content, is becoming a key raw material for TPO production. The segment is expected to reach USD 275.4 million by 2034, growing at a remarkable CAGR of 6.2%. End-of-life tires remain a dominant input, bolstered by widespread recycling initiatives designed to minimize environmental impact and reduce the accumulation of non-biodegradable materials in landfills. Additionally, feedstocks such as oil sludge, wood, and industrial residues are being incorporated into the pyrolysis process, broadening the range of raw materials and enhancing production efficiency.
| Market Scope | |
|---|---|
| Start Year | 2024 |
| Forecast Year | 2025-2034 |
| Start Value | $363.2 Million |
| Forecast Value | $611.9 Million |
| CAGR | 5.4% |
Fast pyrolysis is leading the technological landscape, holding a 60.5% market share in 2024 and valued at USD 219.7 million. Its ability to deliver high oil yields efficiently while consuming less energy positions it as a preferred method for TPO production. Flash pyrolysis, which utilizes rapid heating technologies, is gaining traction for optimizing output quality and process efficiency. On the other hand, slow pyrolysis, though yielding lower oil volumes, continues to produce valuable byproducts such as char and steel, which have significant industrial applications.
The United States is emerging as a key player in the tire pyrolysis oil market, anticipated to reach USD 145.8 million by 2034 with a CAGR of 5.1%. Growth is driven by stringent environmental regulations, recycling mandates, and increased investments in advanced pyrolysis systems. Government incentives to promote sustainable technologies and reduce carbon footprints are further encouraging the adoption of TPO across various sectors. As businesses focus on integrating green practices, the US market is poised to remain at the forefront of innovation and expansion in the global tire pyrolysis oil industry.
Table of Contents
Chapter 1 Methodology & Scope
- 1.1 Market scope & definition
- 1.2 Base estimates & calculations
- 1.3 Forecast calculation
- 1.4 Data sources
- 1.4.1 Primary
- 1.4.2 Secondary
- 1.4.2.1 Paid sources
- 1.4.2.2 Public sources
Chapter 2 Executive Summary
- 2.1 Industry synopsis, 2021-2034
Chapter 3 Industry Insights
- 3.1 Industry ecosystem analysis
- 3.1.1 Factor affecting the value chain
- 3.1.2 Profit margin analysis
- 3.1.3 Disruptions
- 3.1.4 Future outlook
- 3.1.5 Manufacturers
- 3.1.6 Distributors
- 3.2 Supplier landscape
- 3.3 Profit margin analysis
- 3.4 Key news & initiatives
- 3.5 Regulatory landscape
- 3.6 Impact forces
- 3.7 Industry impact forces
- 3.7.1 Growth drivers
- 3.7.1.1 Environmental concerns and waste disposal issues
- 3.7.1.2 Rising fuel prices and economic benefits
- 3.7.1.3 Versatility and adaptability in various applications
- 3.7.2 Market challenges
- 3.7.2.1 Technological limitations and production efficiency
- 3.7.1 Growth drivers
- 3.8 Regulations & market impact
- 3.9 Porter’s analysis
- 3.10 PESTEL analysis
Chapter 4 Competitive Landscape, 2024
- 4.1 Introduction
- 4.2 Company market share analysis
- 4.3 Competitive positioning matrix
- 4.4 Strategic outlook matrix
Chapter 5 Market Size and Forecast, By Raw Material, 2021-2034 (USD Million) (Kilo Tons)
- 5.1 Key trends
- 5.2 Waste plastic
- 5.3 Waste rubber
- 5.4 Wood
- 5.5 Oil sludge
- 5.6 Others
Chapter 6 Market Size and Forecast, By Process, 2021-2034 (USD Million) (Kilo Tons)
- 6.1 Key trends
- 6.2 Fast pyrolysis
- 6.3 Flash pyrolysis
- 6.4 Slow pyrolysis
Chapter 7 Market Size and Forecast, By End Use, 2021-2034 (USD Million) (Kilo Tons)
- 7.1 Key trends
- 7.2 Chemicals
- 7.3 Fuel
- 7.4 Others
Chapter 8 Market Size and Forecast, By Region, 2021-2034 (USD Million) (Kilo Tons)
- 8.1 Key trends
- 8.2 North America
- 8.2.1 U.S.
- 8.2.2 Canada
- 8.3 Europe
- 8.3.1 UK
- 8.3.2 Germany
- 8.3.3 France
- 8.3.4 Italy
- 8.3.5 Spain
- 8.3.6 Russia
- 8.4 Asia Pacific
- 8.4.1 China
- 8.4.2 India
- 8.4.3 Japan
- 8.4.4 South Korea
- 8.4.5 Australia
- 8.5 Latin America
- 8.5.1 Brazil
- 8.5.2 Mexico
- 8.6 MEA
- 8.6.1 South Africa
- 8.6.2 Saudi Arabia
- 8.6.3 UAE
Chapter 9 Company Profiles
- 9.1 Alterra Energy
- 9.2 Bioenergy Ae Cote-Nord
- 9.3 Bridgestone Corporation
- 9.4 Ensyn
- 9.5 Green Fuel Nordic Oy
- 9.6 Mk Aromatics Limited
- 9.7 New Energy Kft.
- 9.8 New Hope Energy
- 9.9 Nexus Circular
- 9.10 Plastic Energy
