
|
市場調査レポート
商品コード
1666956
コイルドチュービング市場の機会、成長促進要因、産業動向分析、2025年~2034年の予測Coiled Tubing Market Opportunity, Growth Drivers, Industry Trend Analysis, and Forecast 2025 - 2034 |
||||||
カスタマイズ可能
|
|||||||
| コイルドチュービング市場の機会、成長促進要因、産業動向分析、2025年~2034年の予測 |
|
出版日: 2024年12月10日
発行: Global Market Insights Inc.
ページ情報: 英文 105 Pages
納期: 2~3営業日
|

全表示
- 概要
- 目次
世界のコイルドチュービング市場は2024年に30億米ドルに達し、2025年から2034年にかけてCAGR 4.5%で成長すると予測されています。
この成長の主な要因は、探査・生産(E&P)投資の増加、エネルギー需要の急増、成熟油田を維持するためのサービス強化の必要性です。効率的な操業、費用対効果、持続可能なソリューションへの注目の高まりが、市場拡大をさらに後押ししています。
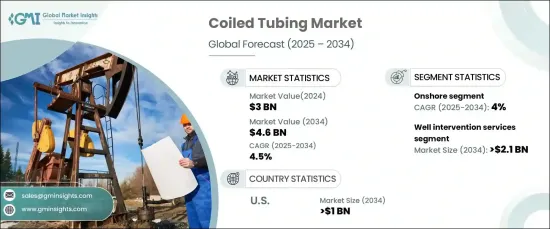
オペレーターが坑井の健全性を向上させ、老朽化した資産の寿命を延ばすことを優先しているため、坑井介在サービス分野は2034年までに21億米ドルを創出すると予想されます。自動化、ダウンホールセンサー、リアルタイムデータ解析などの先端技術の採用は、作業効率と精度を向上させることで坑井掘削作業を変革しています。過酷な坑井条件や複雑な貯留層に対応するため、業界各社は高圧制御システムや耐腐食性合金を含む特殊な材料や機器を開発しており、この分野の成長をさらに促進しています。
| 市場範囲 | |
|---|---|
| 開始年 | 2024 |
| 予測年 | 2025-2034 |
| 開始金額 | 30億米ドル |
| 予測金額 | 46億米ドル |
| CAGR | 4.5% |
陸上コイルドチュービング市場は、石油・ガス事業における費用対効果の高いソリューションに対する需要の高まりに後押しされ、2034年まで4%の成長率を記録すると予測されます。遠隔監視や自動化などの技術の進歩により、コイルドチュービング作業が合理化され、精度が向上し、ダウンタイムが最小限に抑えられています。坑井刺激・破砕サービスは、特に生産強化や保守を必要とする陸上油田で勢いを増しています。この動向は、オペレーターが性能の最適化と生産性の向上を目指している老朽坑井で特に顕著です。
米国のコイルドチュービング市場は、水平掘削や水圧破砕のような技術による炭化水素生産への強い注力が原動力となり、2034年までに10億米ドルを創出する見通しです。エネルギー集約型セクターへの投資拡大と石油・ガス資源の需要増が、市場の成長軌道を強化しています。効率的な資源抽出の必要性と共に、継続的な探査活動もまた、地域全体でコイルドチュービングソリューションの採用拡大に寄与しています。
コイルドチュービング市場は、エネルギー需要の高まり、石油・ガス探査活動の拡大、坑井性能の最適化重視により、一貫した成長を遂げるものと思われます。技術革新は、持続可能でコスト効率の高いソリューションと相まって、操業を再構築し、採用を促進しています。先進的な介入サービスや陸上アプリケーションへの重点の高まりは、今後10年間にわたる市場の着実な拡大の可能性をさらに浮き彫りにしています。
目次
第1章 調査手法と調査範囲
- 市場の定義
- 基本推定と計算
- 予測計算
- データソース
- 1次データ
- 2次データ
- 有償
- 公的
第2章 エグゼクティブサマリー
第3章 業界洞察
- エコシステム分析
- 規制状況
- 業界への影響要因
- 促進要因
- 業界の潜在的リスク&課題
- 成長可能性分析
- ポーターの分析
- 供給企業の交渉力
- 買い手の交渉力
- 新規参入業者の脅威
- 代替品の脅威
- PESTEL分析
第4章 競合情勢
- イントロダクション
- 戦略ダッシュボード
- イノベーションと持続可能性の展望
第5章 市場規模・予測:サービス別、2021年~2034年
- 主要動向
- 坑井作業
- 坑井洗浄
- 坑井仕上げ
- フィッシング
- パーフォレーション
- ロギング
- その他
- 掘削
- 管理圧力ドリル
- 指向性掘削
第6章 市場規模・予測:用途別、2021年~2034年
- 主要動向
- 陸上
- サービス
- 掘削
- 洋上
- 浅瀬
- 深度
- 超深度
第7章 市場規模・予測:地域別、2021年~2034年
- 主要動向
- 北米
- 米国
- カナダ
- 欧州
- ロシア
- 英国
- ノルウェー
- オランダ
- アジア太平洋
- 中国
- インド
- オーストラリア
- インドネシア
- 中東・アフリカ
- サウジアラビア
- アラブ首長国連邦
- エジプト
- ラテンアメリカ
- ブラジル
- メキシコ
- アルゼンチン
第8章 企業プロファイル
- Baker Hughes
- Calfrac Well Services
- CJ Well Services
- Halliburton
- KLX Energy
- Nabors Industries
- National Oilwell Varco
- Nine Energy Service
- Royal IHC
- Schlumberger
- STEP Energy Services
- Tenaris
- Trican
- Weatherford
- Well Service Group
The Global Coiled Tubing Market reached USD 3 billion in 2024 and is anticipated to grow at a CAGR of 4.5% from 2025 to 2034. This growth is primarily driven by rising exploration and production (E&P) investments, surging energy demands, and the need for enhanced services to maintain mature oil fields. Increasing focus on efficient operations, cost-effectiveness, and sustainable solutions is further propelling market expansion.
The well intervention services segment is expected to generate USD 2.1 billion by 2034 as operators prioritize improving well integrity and extending the lifespan of aging assets. The adoption of advanced technologies, such as automation, downhole sensors, and real-time data analytics, is transforming intervention activities by enhancing operational efficiency and precision. To address harsh well conditions and complex reservoirs, industry players are developing specialized materials and equipment, including high-pressure control systems and corrosion-resistant alloys, further driving growth in this segment.
| Market Scope | |
|---|---|
| Start Year | 2024 |
| Forecast Year | 2025-2034 |
| Start Value | $3 Billion |
| Forecast Value | $4.6 Billion |
| CAGR | 4.5% |
The onshore coiled tubing market is projected to witness a growth rate of 4% through 2034, fueled by the increasing demand for cost-effective solutions in oil and gas operations. Advancements in technology, such as remote monitoring and automation, are streamlining coiled tubing operations, improving accuracy, and minimizing downtime. Well stimulation and fracturing services are gaining momentum, particularly for onshore fields requiring production enhancements or maintenance. This trend is particularly evident in aging wells where operators aim to optimize performance and extend productivity.
U.S. coiled tubing market is poised to generate USD 1 billion through 2034, driven by a strong focus on hydrocarbon production through technologies like horizontal drilling and hydraulic fracturing. Growing investments in energy-intensive sectors and the rising demand for oil and gas resources reinforce the market's growth trajectory. Ongoing exploration activities, along with the need for efficient resource extraction, are also contributing to the increased adoption of coiled tubing solutions across the region.
The coiled tubing market is set to experience consistent growth due to rising energy needs, expanding oil and gas exploration activities, and the focus on optimizing well performance. Technological innovations, coupled with sustainable and cost-efficient solutions, are reshaping operations and driving adoption. The increasing emphasis on advanced intervention services and onshore applications further highlights the market's potential for steady expansion over the coming decade.
Table of Contents
Chapter 1 Methodology & Scope
- 1.1 Market definitions
- 1.2 Base estimates & calculations
- 1.3 Forecast calculation
- 1.4 Data sources
- 1.4.1 Primary
- 1.4.2 Secondary
- 1.4.2.1 Paid
- 1.4.2.2 Public
Chapter 2 Executive Summary
- 2.1 Industry 360° synopsis, 2021 - 2034
Chapter 3 Industry Insights
- 3.1 Industry ecosystem analysis
- 3.2 Regulatory landscape
- 3.3 Industry impact forces
- 3.3.1 Growth drivers
- 3.3.2 Industry pitfalls & challenges
- 3.4 Growth potential analysis
- 3.5 Porter's analysis
- 3.5.1 Bargaining power of suppliers
- 3.5.2 Bargaining power of buyers
- 3.5.3 Threat of new entrants
- 3.5.4 Threat of substitutes
- 3.6 PESTEL analysis
Chapter 4 Competitive Landscape, 2024
- 4.1 Introduction
- 4.2 Strategic dashboard
- 4.3 Innovation & sustainability landscape
Chapter 5 Market Size and Forecast, By Service, 2021 – 2034 (USD Million, Units)
- 5.1 Key trends
- 5.2 Well Intervention
- 5.3 Well cleaning
- 5.4 Well completion
- 5.4.1 Fishing
- 5.4.2 Perforation
- 5.4.3 Logging
- 5.4.4 Others
- 5.5 Drilling
- 5.5.1 Managed pressure drilling
- 5.5.2 Directional drilling
Chapter 6 Market Size and Forecast, By Application, 2021 – 2034 (USD Million, Units)
- 6.1 Key trends
- 6.2 Onshore
- 6.2.1 Service
- 6.2.1.1 Well intervention
- 6.2.1.2 Well cleaning
- 6.2.1.3 Well completion
- 6.2.1.3.1 Fishing
- 6.2.1.3.2 Perforation
- 6.2.1.3.3 Logging
- 6.2.1.3.4 Others
- 6.2.1 Service
- 6.2.4 Drilling
- 6.2.4.1 Managed pressure drilling
- 6.2.4.2 Directional drilling
- 6.3 Offshore
- 6.3.1 Shallow
- 6.3.1.1 Well intervention
- 6.3.1.2 Well cleaning
- 6.3.1.3 Well completion
- 6.3.1.3.1 Fishing
- 6.3.1.3.2 Perforation
- 6.3.1.3.3 Logging
- 6.3.1.3.4 Others
- 6.3.1.4 Drilling
- 6.3.1.4.1 Managed pressure drilling
- 6.3.1.4.2 Directional drilling
- 6.3.2 Deep
- 6.3.2.1 Well intervention
- 6.3.2.2 Well cleaning
- 6.3.2.3 Well completion
- 6.3.2.3.1 Fishing
- 6.3.2.3.2 Perforation
- 6.3.2.3.3 Logging
- 6.3.2.3.4 Others
- 6.3.2.4 Drilling
- 6.3.2.4.1 Managed pressure drilling
- 6.3.2.4.2 Directional drilling
- 6.3.3 Ultra-Deep
- 6.3.3.1 Well intervention
- 6.3.3.2 Well cleaning
- 6.3.3.3 Well completion
- 6.3.3.3.1 Fishing
- 6.3.3.3.2 Perforation
- 6.3.3.3.3 Logging
- 6.3.3.3.4 Others
- 6.3.3.4 Drilling
- 6.3.3.4.1 Managed pressure drilling
- 6.3.3.4.2 Directional drilling
- 6.3.1 Shallow
Chapter 7 Market Size and Forecast, By Region, 2021 – 2034 (USD Million, Units)
- 7.1 Key trends
- 7.2 North America
- 7.2.1 U.S.
- 7.2.2 Canada
- 7.3 Europe
- 7.3.1 Russia
- 7.3.2 UK
- 7.3.3 Norway
- 7.3.4 Netherlands
- 7.4 Asia Pacific
- 7.4.1 China
- 7.4.2 India
- 7.4.3 Australia
- 7.4.4 Indonesia
- 7.5 Middle East & Africa
- 7.5.1 Saudi Arabia
- 7.5.2 UAE
- 7.5.3 Egypt
- 7.6 Latin America
- 7.6.1 Brazil
- 7.6.2 Mexico
- 7.6.3 Argentina
Chapter 8 Company Profiles
- 8.1 Baker Hughes
- 8.2 Calfrac Well Services
- 8.3 CJ Well Services
- 8.4 Halliburton
- 8.5 KLX Energy
- 8.6 Nabors Industries
- 8.7 National Oilwell Varco
- 8.8 Nine Energy Service
- 8.9 Royal IHC
- 8.10 Schlumberger
- 8.11 STEP Energy Services
- 8.12 Tenaris
- 8.13 Trican
- 8.14 Weatherford
- 8.15 Well Service Group
