
|
市場調査レポート
商品コード
1665362
ラインコード商用サージ保護デバイスの市場機会、成長促進要因、産業動向分析、2025年~2034年予測Line Cord Commercial Surge Protection Devices Market Opportunity, Growth Drivers, Industry Trend Analysis, and Forecast 2025 - 2034 |
||||||
カスタマイズ可能
|
|||||||
| ラインコード商用サージ保護デバイスの市場機会、成長促進要因、産業動向分析、2025年~2034年予測 |
|
出版日: 2024年12月24日
発行: Global Market Insights Inc.
ページ情報: 英文 105 Pages
納期: 2~3営業日
|

全表示
- 概要
- 目次
ラインコード商用サージ保護デバイスの世界市場は、2024年に2億5,250万米ドルの評価額を記録し、2025~2034年にかけてのCAGRは6.4%と予測され、力強い成長を遂げると予測されています。
このような急成長の背景には、データ損失や機器の損傷、経済的影響につながる可能性のある電力サージから、機密性の高い電気機器を保護する必要性の高まりがあります。データセンター、ITインフラ、スマートビルディングにおけるサージ保護デバイスへの依存度が高まっていることが、この不可欠な技術に対する需要をさらに高めています。
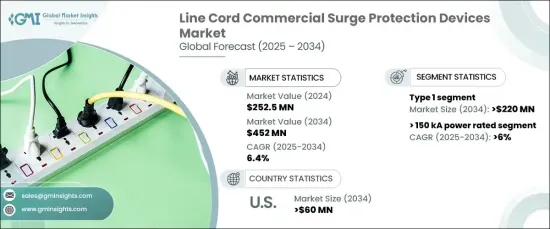
タイプ1のサージ保護デバイスセグメントは、優れた電圧クランピングと迅速な応答時間を提供する統合保護ソリューションへの嗜好の高まりに後押しされ、2034年までに2億2,000万米ドルに達すると予測されます。スマートビルディング技術の普及は、モノのインターネット(IoT)対応の自動化の普及と相まって、この市場セグメントの拡大を促進しています。先進的電気システムへの投資の増加やモニタリング機能の強化とともに、安全規制の強化がこれらのデバイスの採用を加速し、現代のインフラにおける重要な役割を強化すると予想されます。
| 市場範囲 | |
|---|---|
| 開始年 | 2024年 |
| 予測年 | 2025~2034年 |
| 開始金額 | 2億5,250万米ドル |
| 予測金額 | 4億5,200万米ドル |
| CAGR | 6.4% |
定格が150kAを超えるサージ保護デバイスは、2034年までCAGR 6%で成長すると予測されます。この成長は、より高いサージ電流定格に対応するように設計された最先端技術システムの統合によるもので、電気的障害に対する貴重な資産の保護を保証します。このような高出力デバイスに対する需要の増加は、医療やデータセンターなどの重要部門で特に顕著です。さらに、雷雨や落雷などの異常気象の発生が増加していることから、堅牢なサージ保護システムの重要性が強調され、さまざまな産業で採用が進んでいます。
米国では、ラインコードの商用サージ保護デバイス市場は2034年までに6,000万米ドルを生み出すと予想されています。この成長の原動力となっているのは、重要インフラや高感度の電子機器を電気的サージから保護する必要性の高まりです。電力網ネットワークの近代化と、商用環境におけるサーバー、医療機器、自動化システムなどの高感度電子機器の広範な使用とが相まって、サージ保護デバイスの需要に拍車をかけています。これらの進歩は、重要なシステムの信頼性の高い動作を保証し、今後数年間の市場の大きな可能性を強調しています。
目次
第1章 調査手法と調査範囲
- 市場範囲と定義
- 市場推定・予測パラメータ
- 予測計算
- データソース
- 一次データ
- 二次データ
- 有料
- 公的
第2章 エグゼクティブサマリー
第3章 産業洞察
- エコシステム分析
- 規制状況
- 産業への影響要因
- 促進要因
- 産業の潜在的リスク・課題
- 成長ポテンシャル分析
- ポーター分析
- 供給企業の交渉力
- 買い手の交渉力
- 新規参入業者の脅威
- 代替品の脅威
- PESTEL分析
第4章 競合情勢
- イントロダクション
- 戦略的展望
- イノベーションと持続可能性の展望
第5章 市場規模・予測:技術別、2021~2034年
- 主要動向
- タイプ1
- タイプ2
- タイプ3
第6章 市場規模・予測:定格出力別、2021~2034年
- 主要動向
- 50kA
- 50~100kA
- 100~150kA
- 150kA
第7章 市場規模・予測:地域別、2021~2034年
- 主要動向
- 北米
- 米国
- カナダ
- メキシコ
- 欧州
- ドイツ
- フランス
- ロシア
- 英国
- イタリア
- スペイン
- オランダ
- オーストリア
- アジア太平洋
- 中国
- 日本
- 韓国
- インド
- オーストラリア
- ニュージーランド
- マレーシア
- インドネシア
- 中東・アフリカ
- サウジアラビア
- アラブ首長国連邦
- カタール
- エジプト
- 南アフリカ
- ナイジェリア
- クウェート
- オマーン
- ラテンアメリカ
- ブラジル
- ペルー
- アルゼンチン
第8章 企業プロファイル
- ABB
- Belkin
- Eaton
- Emerson Electric
- Hubbell
- Intermatic
- JMV
- Legrand
- Littelfuse
- LS Electric
- Mersen
- Raycap
- Phoenix Contact
- Schneider Electric
- Siemens
- Socomec
The Global Line Cord Commercial Surge Protection Devices Market is projected to experience robust growth, with a valuation of USD 252.5 million in 2024 and a forecasted compound annual growth rate (CAGR) of 6.4% between 2025 and 2034. This surge is driven by the escalating need to safeguard sensitive electrical equipment from power surges, which can result in data loss, equipment damage, and significant financial repercussions. The increasing dependence on surge protection devices across data centers, IT infrastructures, and smart buildings further amplifies the demand for this essential technology.
The Type 1 surge protection device segment is anticipated to reach USD 220 million by 2034, propelled by the growing preference for integrated protection solutions offering superior voltage clamping and rapid response times. The proliferation of smart building technologies, coupled with the widespread adoption of Internet of Things (IoT)-enabled automation, is fostering the expansion of this market segment. Stricter safety regulations, alongside heightened investments in advanced electrical systems and enhanced monitoring capabilities, are expected to accelerate the adoption of these devices, reinforcing their critical role in modern infrastructures.
| Market Scope | |
|---|---|
| Start Year | 2024 |
| Forecast Year | 2025-2034 |
| Start Value | $252.5 Million |
| Forecast Value | $452 Million |
| CAGR | 6.4% |
Surge protection devices with ratings exceeding 150 kA are forecasted to grow at a CAGR of 6% through 2034. This growth is attributed to the integration of cutting-edge technological systems designed to handle higher surge current ratings, ensuring the protection of valuable assets against electrical disturbances. Increasing demand for these high-powered devices is particularly notable in critical sectors such as healthcare and data centers. Additionally, the rising occurrence of extreme weather events, including thunderstorms and lightning strikes, underscores the importance of robust surge protection systems, driving their adoption across diverse industries.
In the United States, the line cord commercial surge protection devices market is expected to generate USD 60 million by 2034. This growth is driven by an increasing need to protect essential infrastructure and sensitive electronics from electrical surges. The modernization of electrical grid networks, coupled with the widespread use of sensitive electronic equipment such as servers, medical devices, and automated systems in commercial environments, is fueling the demand for surge protection devices. These advancements ensure the reliable operation of critical systems, underscoring the market's significant potential in the coming years.
Table of Contents
Chapter 1 Methodology & Scope
- 1.1 Market scope & definitions
- 1.2 Market estimates & forecast parameters
- 1.3 Forecast calculation
- 1.4 Data sources
- 1.4.1 Primary
- 1.4.2 Secondary
- 1.4.2.1 Paid
- 1.4.2.2 Public
Chapter 2 Executive Summary
- 2.1 Industry synopsis, 2021 - 2034
Chapter 3 Industry Insights
- 3.1 Industry ecosystem analysis
- 3.2 Regulatory landscape
- 3.3 Industry impact forces
- 3.3.1 Growth drivers
- 3.3.2 Industry pitfalls & challenges
- 3.4 Growth potential analysis
- 3.5 Porter's analysis
- 3.5.1 Bargaining power of suppliers
- 3.5.2 Bargaining power of buyers
- 3.5.3 Threat of new entrants
- 3.5.4 Threat of substitutes
- 3.6 PESTEL analysis
Chapter 4 Competitive Landscape, 2024
- 4.1 Introduction
- 4.2 Strategic outlook
- 4.3 Innovation & sustainability landscape
Chapter 5 Market Size and Forecast, By Technology, 2021 – 2034 ('000 Units & USD Million)
- 5.1 Key trends
- 5.2 Type 1
- 5.3 Type 2
- 5.4 Type 3
Chapter 6 Market Size and Forecast, By Power Rating, 2021 – 2034 ('000 Units & USD Million)
- 6.1 Key trends
- 6.2 ≤ 50 kA
- 6.3 > 50 kA to 100 kA
- 6.4 > 100 kA to 150 kA
- 6.5 > 150 kA
Chapter 7 Market Size and Forecast, By Region, 2021 – 2034 ('000 Units & USD Million)
- 7.1 Key trends
- 7.2 North America
- 7.2.1 U.S.
- 7.2.2 Canada
- 7.2.3 Mexico
- 7.3 Europe
- 7.3.1 Germany
- 7.3.2 France
- 7.3.3 Russia
- 7.3.4 UK
- 7.3.5 Italy
- 7.3.6 Spain
- 7.3.7 Netherlands
- 7.3.8 Austria
- 7.4 Asia Pacific
- 7.4.1 China
- 7.4.2 Japan
- 7.4.3 South Korea
- 7.4.4 India
- 7.4.5 Australia
- 7.4.6 New Zealand
- 7.4.7 Malaysia
- 7.4.8 Indonesia
- 7.5 Middle East & Africa
- 7.5.1 Saudi Arabia
- 7.5.2 UAE
- 7.5.3 Qatar
- 7.5.4 Egypt
- 7.5.5 South Africa
- 7.5.6 Nigeria
- 7.5.7 Kuwait
- 7.5.8 Oman
- 7.6 Latin America
- 7.6.1 Brazil
- 7.6.2 Peru
- 7.6.3 Argentina
Chapter 8 Company Profiles
- 8.1 ABB
- 8.2 Belkin
- 8.3 Eaton
- 8.4 Emerson Electric
- 8.5 Hubbell
- 8.6 Intermatic
- 8.7 JMV
- 8.8 Legrand
- 8.9 Littelfuse
- 8.10 LS Electric
- 8.11 Mersen
- 8.12 Raycap
- 8.13 Phoenix Contact
- 8.14 Schneider Electric
- 8.15 Siemens
- 8.16 Socomec
