
|
市場調査レポート
商品コード
1665323
製造規模電気集塵装置市場の市場機会、成長促進要因、産業動向分析、2025年~2034年予測Manufacturing Scale Electrostatic Precipitator Market Opportunity, Growth Drivers, Industry Trend Analysis, and Forecast 2025 - 2034 |
||||||
カスタマイズ可能
|
|||||||
| 製造規模電気集塵装置市場の市場機会、成長促進要因、産業動向分析、2025年~2034年予測 |
|
出版日: 2024年12月23日
発行: Global Market Insights Inc.
ページ情報: 英文 112 Pages
納期: 2~3営業日
|

全表示
- 概要
- 目次
世界の製造規模電気集塵装置市場は、2024年に8億6,520万米ドルに達し、2025~2034年にかけて6.8%のCAGRで堅調に成長すると予測されています。
これらの先進的装置は、産業排ガスから微小粒子状物質を効果的に除去することで、大気汚染防止に重要な役割を果たしています。この装置は、ガス流中の粒子を高電圧の電界で帯電させ、粒子を反対に帯電したシートまたはプローブ上に集めることで作動します。蓄積された粒子は振動または槌打によって定期的に除去され、継続的な効率と高性能が保証されます。
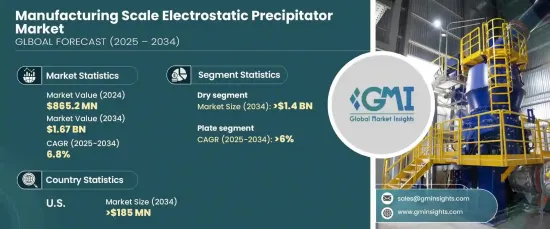
乾式電気集塵装置セグメントは大きな成長を遂げ、2034年までに14億米ドルに達する見込みです。このシステムタイプは、高効率の粒子捕集を実現する能力が高く評価され、厳しい環境基準を満たし、さまざまな産業で広く採用されています。製造業者は、その安定した性能と最小限の運転休止時間により、乾式電気集塵装置を選ぶようになってきています。これらのシステムは生産性の目標と環境規制の遵守をサポートし、耐久性と低メンテナンス要件は長期的な大幅なコスト削減につながるため、経済性と環境の持続可能性の両方を重視する施設にとって理想的な選択肢となっています。
| 市場範囲 | |
|---|---|
| 開始年 | 2024年 |
| 予測年 | 2025~2034年 |
| 開始金額 | 8億6,520万米ドル |
| 予測金額 | 16億7,000万米ドル |
| CAGR | 6.8% |
設計面では、平版電気集塵装置は2034年までCAGR 6%で成長すると予測されます。優れた微粒子捕集効率で知られるプレート式設計は、微粒子や超微粒子の捕集に優れているため、さまざまな排出プロファイルを扱う産業に最適です。性能を損なうことなく変動する粉塵負荷に対応する能力は、特に産業が腐食、高温、摩耗に強い設計を求めるようになっている中で、その魅力を高めています。このような要因が、最も厳しい使用環境において長期にわたる信頼性を提供するというプレート型電気集塵装置の評判につながっています。
米国の製造規模電気集塵装置市場は2034年までに1億8,500万米ドルを生み出すと予測されています。環境の持続可能性が最優先事項となるにつれ、米国全土の産業はよりクリーンな技術を採用する必要に迫られており、電気集塵装置の需要を押し上げています。大気汚染防止法などによる厳しい大気質規制の施行により、粒子状物質の排出量の大幅な削減が義務付けられており、市場拡大の好機となっています。さらに、メンテナンスコストの削減と長期的な投資収益率の向上を目指した技術革新が、市場導入をさらに促進し、この地域全体の着実な成長を確実なものにしています。
目次
第1章 調査手法と調査範囲
- 調査デザイン
- 基本推定と計算
- 予測モデル
- 一次調査と検証
- 一次情報
- データマイニングソース
- 市場定義
第2章 エグゼクティブサマリー
第3章 産業洞察
- 産業エコシステム
- 規制状況
- 産業への影響要因
- 促進要因
- 産業の潜在的リスク・課題
- 成長可能性分析
- ポーター分析
- 供給企業の交渉力
- 買い手の交渉力
- 新規参入業者の脅威
- 代替品の脅威
- PESTEL分析
第4章 競争情勢
- イントロダクション
- 戦略ダッシュボード
- イノベーションと技術の展望
第5章 市場規模・予測:デザイン別、2021~2034年
- 主要動向
- 平板
- 管状
第6章 市場規模・予測:システム別、2021~2034年
- 主要動向
- 乾式
- 湿式
第7章 市場規模・予測:地域別、2021~2034年
- 主要動向
- 北米
- 米国
- カナダ
- メキシコ
- 欧州
- ドイツ
- 英国
- フランス
- スペイン
- イタリア
- オランダ
- アジア太平洋
- 中国
- インド
- 日本
- 韓国
- インドネシア
- オーストラリア
- 中東・アフリカ
- サウジアラビア
- アラブ首長国連邦
- 南アフリカ
- ナイジェリア
- アンゴラ
- ラテンアメリカ
- ブラジル
- アルゼンチン
- チリ
- ペルー
第8章 企業プロファイル
- ANDRITZ GROUP
- Babcock &Wilcox
- Beltran Technologies
- Elex
- Environ Engineers
- GEA Group
- Kraft Powercon
- Thermax
- VT Corp
- Valmet
The Global Manufacturing Scale Electrostatic Precipitator Market reached USD 865.2 million in 2024 and is projected to grow at a robust CAGR of 6.8% from 2025 to 2034. These advanced devices play a crucial role in air pollution control by effectively removing fine particulate matter from industrial flue gases. They operate by charging particles in the gas stream with high-voltage electrical fields, causing the particles to collect on oppositely charged sheets or probes. The accumulated particles are periodically dislodged using vibration or rapping, ensuring continuous efficiency and high performance.
The dry electrostatic precipitator segment is set to experience significant growth, expected to reach USD 1.4 billion by 2034. This system type is highly valued for its ability to provide high-efficiency particle collection, meeting stringent environmental standards and driving widespread adoption across various industries. Manufacturers are increasingly opting for dry electrostatic precipitators due to their consistent performance and minimal operational downtime. These systems support productivity goals and compliance with environmental regulations, while their durability and low maintenance requirements translate into substantial long-term cost savings, making them an ideal choice for facilities focused on both economic and environmental sustainability.
| Market Scope | |
|---|---|
| Start Year | 2024 |
| Forecast Year | 2025-2034 |
| Start Value | $865.2 Million |
| Forecast Value | $1.67 Billion |
| CAGR | 6.8% |
In terms of design, the plate electrostatic precipitator segment is anticipated to grow at a CAGR of 6% through 2034. Renowned for its superior particulate collection efficiency, the plate design excels at capturing fine and ultrafine particles, making it perfect for industries dealing with varying emission profiles. Its ability to handle fluctuating dust loads without compromising performance boosts its appeal, especially as industries increasingly demand designs resistant to corrosion, high temperatures, and wear. These factors contribute to the plate electrostatic precipitator's reputation for providing long-lasting reliability in the most challenging operating environments.
The U.S. manufacturing scale electrostatic precipitator market is forecasted to generate USD 185 million by 2034. As environmental sustainability becomes a top priority, industries across the U.S. are under growing pressure to adopt cleaner technologies, driving up the demand for electrostatic precipitators. The enforcement of strict air quality regulations by agencies, including the Clean Air Act, mandates significant reductions in particulate emissions, creating lucrative opportunities for market expansion. Additionally, innovations aimed at reducing maintenance costs and enhancing long-term returns on investment are further propelling market adoption and ensuring steady growth across the region.
Table of Contents
Chapter 1 Methodology & Scope
- 1.1 Research design
- 1.2 Base estimates & calculations
- 1.3 Forecast model
- 1.4 Primary research & validation
- 1.4.1 Primary sources
- 1.4.2 Data mining sources
- 1.5 Market definitions
Chapter 2 Executive Summary
- 2.1 Industry synopsis, 2021 – 2034
Chapter 3 Industry Insights
- 3.1 Industry ecosystem
- 3.2 Regulatory landscape
- 3.3 Industry impact forces
- 3.3.1 Growth drivers
- 3.3.2 Industry pitfalls & challenges
- 3.4 Growth potential analysis
- 3.5 Porter's analysis
- 3.5.1 Bargaining power of suppliers
- 3.5.2 Bargaining power of buyers
- 3.5.3 Threat of new entrants
- 3.5.4 Threat of substitutes
- 3.6 PESTEL analysis
Chapter 4 Competitive landscape, 2024
- 4.1 Introduction
- 4.2 Strategic dashboard
- 4.3 Innovation & technology landscape
Chapter 5 Market Size and Forecast, By Design, 2021 – 2034 (USD Million)
- 5.1 Key trends
- 5.2 Plate
- 5.3 Tubular
Chapter 6 Market Size and Forecast, By System, 2021 – 2034 (USD Million)
- 6.1 Key trends
- 6.2 Dry
- 6.3 Wet
Chapter 7 Market Size and Forecast, By Region, 2021 – 2034 (USD Million)
- 7.1 Key trends
- 7.2 North America
- 7.2.1 U.S.
- 7.2.2 Canada
- 7.2.3 Mexico
- 7.3 Europe
- 7.3.1 Germany
- 7.3.2 UK
- 7.3.3 France
- 7.3.4 Spain
- 7.3.5 Italy
- 7.3.6 Netherlands
- 7.4 Asia Pacific
- 7.4.1 China
- 7.4.2 India
- 7.4.3 Japan
- 7.4.4 South Korea
- 7.4.5 Indonesia
- 7.4.6 Australia
- 7.5 Middle East & Africa
- 7.5.1 Saudi Arabia
- 7.5.2 UAE
- 7.5.3 South Africa
- 7.5.4 Nigeria
- 7.5.5 Angola
- 7.6 Latin America
- 7.6.1 Brazil
- 7.6.2 Argentina
- 7.6.3 Chile
- 7.6.4 Peru
Chapter 8 Company Profiles
- 8.1 ANDRITZ GROUP
- 8.2 Babcock & Wilcox
- 8.3 Beltran Technologies
- 8.4 Elex
- 8.5 Environ Engineers
- 8.6 GEA Group
- 8.7 Kraft Powercon
- 8.8 Thermax
- 8.9 VT Corp
- 8.10 Valmet

