
|
市場調査レポート
商品コード
1665295
眼圧計の市場機会と促進要因、業界動向分析、2025~2034年予測Tonometers Market Opportunity, Growth Drivers, Industry Trend Analysis, and Forecast 2025 - 2034 |
||||||
カスタマイズ可能
|
|||||||
| 眼圧計の市場機会と促進要因、業界動向分析、2025~2034年予測 |
|
出版日: 2024年12月19日
発行: Global Market Insights Inc.
ページ情報: 英文 135 Pages
納期: 2~3営業日
|

全表示
- 概要
- 目次
眼圧計の世界市場は2024年に3億7,350万米ドルと評価され、2025~2034年のCAGRは5.1%と堅調な成長が見込まれています。
この成長の原動力は、緑内障やその他の眼疾患の有病率の上昇、眼の健康に対する意識の高まり、世界人口の高齢化です。眼圧計は、緑内障のような眼の状態を管理する上で重要な指標である眼圧(IOP)の診断とモニタリングに不可欠なツールであり、世界中の臨床現場で欠かせないものとなっています。
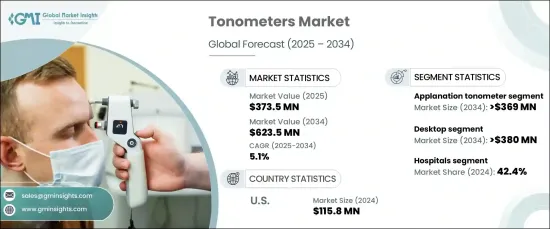
市場は技術別に区分され、主要カテゴリーにはアプラネーション眼圧計、リバウンド眼圧計、インデンテーション眼圧計、その他の先端技術が含まれます。2024年にはアプラネーション眼圧計が市場を席巻し、2034年には3億6,900万米ドルに達すると予測されています。その精度と信頼性で知られるアプラネーション眼圧計は、臨床環境における眼圧測定のゴールドスタンダードとみなされています。特に緑内障の診断や管理に広く使用されており、高い需要を後押ししています。また、角膜浮腫を伴う症例では、角膜の厚さの変化を考慮するためにパチメトリーと組み合わせることができ、正確な眼圧測定が可能になるため、これらの装置が好まれています。多くの眼圧計は細隙灯顕微鏡と一体化されており、定期的な眼科検査や診断の際の機能性を高めています。
| 市場範囲 | |
|---|---|
| 開始年 | 2024年 |
| 予測年 | 2025~2034 |
| 開始金額 | 3億7,350万米ドル |
| 予測金額 | 6億2,350万米ドル |
| CAGR | 5.1% |
エンドユーザー別では、眼圧計市場は病院、眼科クリニック、外来手術センター、その他の医療施設に分類されます。病院は2024年に42.4%と大きな市場シェアを占めています。これらの施設では、さまざまな患者、特に緑内障管理などの専門的なニーズを持つ患者を扱っており、需要に対応するために複数の眼圧計を必要とすることが多いです。病院における眼圧計の高い使用率は、定期的な眼科検査、緊急眼科医療、眼疾患の経過観察に起因しています。病院における眼科部門の拡大は、市場をさらに押し上げると予想されます。また、病院は、角膜の不整や手術後の眼など、複雑な眼の状態を管理できる先進的眼圧計を好む傾向があります。
米国では、眼圧計市場は2024年に1億1,580万米ドルとなり、2025~2034年にかけてCAGR 3%で成長すると予測されています。米国は、自動眼圧計、非接触眼圧計、AI搭載眼圧計など、診断精度を高め、患者の快適性を向上させる最先端技術の採用で最先端を走っています。さらに、米国の病院やクリニックでは、電子カルテ(EMR)とシームレスに統合し、ワークフローの合理化と患者ケアの効率化を支援する眼圧計を求める傾向が強まっています。政府のイニシアチブと予防的眼科医療を促進する民間セクターの取り組みが、米国における眼圧計の需要増加の主要要因です。定期的な眼科検診に対する主要な眼科組織からの提唱は、市場の拡大にさらに貢献し、国全体で眼圧計の必要性が高まっています。
目次
第1章 調査手法と調査範囲
第2章 エグゼクティブサマリー
第3章 産業洞察
- エコシステム分析
- 産業への影響要因
- 促進要因
- 緑内障と眼疾患の有病率の上昇
- 機器の技術的進歩
- 目の健康に対する意識の高まり
- 糖尿病患者の増加
- 産業の潜在的リスク・課題
- 感染のリスクと結果の正確性の欠如
- 促進要因
- 成長可能性分析
- 規制状況
- 償還シナリオ
- 技術
- ギャップ分析
- ポーター分析
- PESTEL分析
- 今後の市場動向
第4章 競合情勢
- イントロダクション
- 企業マトリックス分析
- 企業シェア分析
- 主要市場企業の競合分析
- 競合のポジショニングマトリックス
- 戦略ダッシュボード
第5章 市場推定・予測:技術別、2021~2034年
- 主要動向
- アプラネーション眼圧計
- リバウンド眼圧計
- インデンテーション眼圧計
- その他
第6章 市場推定・予測:ポータビリティ別、2021~2034年
- 主要動向
- 卓上型
- ハンドヘルド
第7章 市場推定・予測:最終用途別、2021~2034年
- 主要動向
- 病院
- 眼科クリニック
- 外来手術センター
- その他
第8章 市場推定・予測:地域別、2021~2034年
- 主要動向
- 北米
- 米国
- カナダ
- 欧州
- ドイツ
- 英国
- フランス
- スペイン
- イタリア
- オランダ
- アジア太平洋
- 中国
- 日本
- インド
- オーストラリア
- 韓国
- ラテンアメリカ
- ブラジル
- メキシコ
- アルゼンチン
- 中東・アフリカ
- 南アフリカ
- サウジアラビア
- アラブ首長国連邦
第9章 企業プロファイル
- Canon
- HAAG-STREIT GROUP
- Huvitz
- iCare
- Keeler
- Kowa
- NIDEK
- OCULUS
- Reichert AMETEK
- Rexxam
- TOMEY
- TOPCON
- 66 Vision-Tech
The Global Tonometers Market was valued at USD 373.5 million in 2024 and is expected to experience robust growth, with a CAGR of 5.1% from 2025 to 2034. This growth is driven by the rising prevalence of glaucoma and other ocular conditions, increased awareness about eye health, and the aging global population. Tonometers are essential tools in diagnosing and monitoring intraocular pressure (IOP), a critical indicator in managing eye conditions like glaucoma, making them indispensable in clinical settings worldwide.
The market is segmented by technology, with key categories including applanation tonometers, rebound tonometers, indentation tonometers, and other advanced technologies. Applanation tonometers dominated the market in 2024 and are expected to reach USD 369 million by 2034. Known for their precision and reliability, applanation tonometers are regarded as the gold standard for IOP measurement in clinical environments. Their widespread use, particularly in diagnosing and managing glaucoma, fuels their high demand. These devices are also preferred in cases involving corneal edema, as they can be paired with pachymetry to account for variations in corneal thickness, ensuring accurate pressure readings. Many applanation tonometers are integrated with slit lamp microscopes, enhancing their functionality during routine eye exams and diagnostic procedures.
| Market Scope | |
|---|---|
| Start Year | 2024 |
| Forecast Year | 2025-2034 |
| Start Value | $373.5 Million |
| Forecast Value | $623.5 Million |
| CAGR | 5.1% |
In terms of end-users, the tonometer market is categorized into hospitals, ophthalmic clinics, ambulatory surgical centers, and other healthcare facilities. Hospitals held a significant market share of 42.4% in 2024. These institutions handle a wide array of patients, particularly those with specialized needs, such as glaucoma management, and often require multiple tonometers to accommodate demand. The high usage of tonometers in hospitals can be attributed to routine eye exams, emergency eye care, and follow-up visits for ocular conditions. The expansion of ophthalmology departments in hospitals is anticipated to further boost the market. Hospitals also tend to favor advanced tonometers capable of managing complex eye conditions, including corneal irregularities and post-surgical eyes.
In the U.S., the tonometer market was valued at USD 115.8 million in 2024 and is projected to grow at a CAGR of 3% between 2025 and 2034. The U.S. is at the forefront of adopting cutting-edge technologies such as automated, non-contact, and AI-powered tonometers, which enhance diagnostic accuracy and improve patient comfort. Additionally, there is a growing trend in U.S. hospitals and clinics toward tonometers that seamlessly integrate with electronic medical records (EMRs), helping streamline workflow and improving efficiency in patient care. Government initiatives and private sector efforts promoting preventive eye care are key drivers behind the increased demand for tonometers in the U.S. Advocacy from leading ophthalmic organizations for regular eye exams further contributes to the market's expansion, ensuring a growing need for tonometry devices across the country.
Table of Contents
Chapter 1 Methodology and Scope
- 1.1 Market scope and definitions
- 1.2 Research design
- 1.2.1 Research approach
- 1.2.2 Data collection methods
- 1.3 Base estimates and calculations
- 1.3.1 Base year calculation
- 1.3.2 Key trends for market estimation
- 1.4 Forecast model
- 1.5 Primary research and validation
- 1.5.1 Primary sources
- 1.5.2 Data mining sources
Chapter 2 Executive Summary
- 2.1 Industry 3600 synopsis
Chapter 3 Industry Insights
- 3.1 Industry ecosystem analysis
- 3.2 Industry impact forces
- 3.2.1 Growth drivers
- 3.2.1.1 Rising prevalence of glaucoma and ocular diseases
- 3.2.1.2 Technological advancements in devices
- 3.2.1.3 Growing awareness towards eye health
- 3.2.1.4 Increase in number of diabetic patients
- 3.2.2 Industry pitfalls and challenges
- 3.2.2.1 Risk of infection and lack of accuracy in results
- 3.2.1 Growth drivers
- 3.3 Growth potential analysis
- 3.4 Regulatory landscape
- 3.5 Reimbursement scenario
- 3.6 Technology landscape
- 3.7 Gap analysis
- 3.8 Porter's analysis
- 3.9 PESTEL analysis
- 3.10 Future market trends
Chapter 4 Competitive Landscape, 2024
- 4.1 Introduction
- 4.2 Company matrix analysis
- 4.3 Company market share analysis
- 4.4 Competitive analysis of major market players
- 4.5 Competitive positioning matrix
- 4.6 Strategy dashboard
Chapter 5 Market Estimates and Forecast, By Technology, 2021 – 2034 ($ Mn)
- 5.1 Key trends
- 5.2 Applanation tonometer
- 5.3 Rebound tonometer
- 5.4 Indentation tonometer
- 5.5 Other technologies
Chapter 6 Market Estimates and Forecast, By Portability, 2021 – 2034 ($ Mn)
- 6.1 Key trends
- 6.2 Desktop
- 6.3 Handheld
Chapter 7 Market Estimates and Forecast, By End Use, 2021 – 2034 ($ Mn)
- 7.1 Key trends
- 7.2 Hospitals
- 7.3 Ophthalmic clinics
- 7.4 Ambulatory surgical centers
- 7.5 Other end users
Chapter 8 Market Estimates and Forecast, By Region, 2021 – 2034 ($ Mn)
- 8.1 Key trends
- 8.2 North America
- 8.2.1 U.S.
- 8.2.2 Canada
- 8.3 Europe
- 8.3.1 Germany
- 8.3.2 UK
- 8.3.3 France
- 8.3.4 Spain
- 8.3.5 Italy
- 8.3.6 Netherlands
- 8.4 Asia Pacific
- 8.4.1 China
- 8.4.2 Japan
- 8.4.3 India
- 8.4.4 Australia
- 8.4.5 South Korea
- 8.5 Latin America
- 8.5.1 Brazil
- 8.5.2 Mexico
- 8.5.3 Argentina
- 8.6 Middle East and Africa
- 8.6.1 South Africa
- 8.6.2 Saudi Arabia
- 8.6.3 UAE
Chapter 9 Company Profiles
- 9.1 Canon
- 9.2 HAAG-STREIT GROUP
- 9.3 Huvitz
- 9.4 iCare
- 9.5 Keeler
- 9.6 Kowa
- 9.7 NIDEK
- 9.8 OCULUS
- 9.9 Reichert AMETEK
- 9.10 Rexxam
- 9.11 TOMEY
- 9.12 TOPCON
- 9.13 66 Vision-Tech
