
|
市場調査レポート
商品コード
1665253
高度公共交通システム市場の市場機会、成長促進要因、産業動向分析、2025~2034年予測Advanced Public Transportation System (APTS) Market Opportunity, Growth Drivers, Industry Trend Analysis, and Forecast 2025 - 2034 |
||||||
カスタマイズ可能
|
|||||||
| 高度公共交通システム市場の市場機会、成長促進要因、産業動向分析、2025~2034年予測 |
|
出版日: 2024年12月18日
発行: Global Market Insights Inc.
ページ情報: 英文 180 Pages
納期: 2~3営業日
|

全表示
- 概要
- 目次
世界の高度公共交通システム市場は、2024年には64億米ドルと評価され、2025~2034年のCAGRは8.3%と、目覚ましい成長が見込まれています。
この成長は、スマート交通ソリューションへの政府投資の増加と、サステイナブル都市モビリティへのシフトが主要要因となっています。この市場拡大の主要要因は、二酸化炭素排出量の削減、公共旅客の効率改善、都市モビリティ向上のための革新的ソリューションの提供を優先する、スマートシティに対する需要の高まりです。
APTS市場は、リアルタイム旅客情報システム、自動車両位置情報(AVL)、コンピュータ支援配車(CAD)、電子決済システム(EPS)、旅客情報システム(PIS)など、複数の技術主導セグメントにまたがっています。このうち、リアルタイム旅客情報システムセグメントは2024年に30%の圧倒的シェアを占め、2034年までに40億米ドルを生み出すと予測されています。これらの先進システムは、人工知能と機械学習を活用して予測分析を行い、旅客体験を向上させています。過去のデータとリアルタイムのデータの両方を分析することで、これらのシステムは需要を予測し、旅客ルートを最適化し、混雑のホットスポットを特定し、最終的にサービスの提供と効率を向上させています。
| 市場範囲 | |
|---|---|
| 開始年 | 2024年 |
| 予測年 | 2025~2034 |
| 開始金額 | 64億米ドル |
| 予測金額 | 139億米ドル |
| CAGR | 8.3% |
旅客手段別に見ると、APTS市場は道路、鉄道、空路、水路に分けられます。車道セグメントは、いくつかの新たな動向に牽引され、2034年までに65億米ドルに達すると予想されます。多くの都市が、専用レーン、先進的センサネットワーク、インテリジェント交通システムを備えた、自律的な公共交通のために設計された特殊な道路に投資しています。このようなスマートコリドーは、バスやシャトルなどの自律走行車を優先するように調整されており、渋滞を緩和し、安全性を高め、より予測可能な移動時間を確保するために、車両間通信(V2I)を統合しています。このような最先端技術と思慮深い都市計画の融合は、モビリティを合理化し、交通システムの全体的な効率を高めることになります。
米国では、APTS市場は2024年に45%の大きなシェアを占めます。米国の都市は、特に空港、キャンパス、ビジネス街などの管理された環境において、自律走行型電動シャトルサービスの導入を主導しています。これらのAI搭載シャトルは、労働力不足への対応、運営コストの削減、安全性と効率性の向上に役立っています。米国の著名な技術拠点はこのイノベーションの最前線にあり、ヒューマンエラーを最小限に抑え、スマートな都市モビリティインフラの開発を進めることに注力しています。このような集中的な取り組みにより、米国は世界のAPTS市場で圧倒的な地位を確立しています。
目次
第1章 調査手法と調査範囲
- 調査デザイン
- 調査アプローチ
- データ収集方法
- 基本推定と計算
- 基準年の算出
- 市場推定の主要動向
- 予測モデル
- 1次調査と検証
- 一次情報
- データマイニングソース
- 市場定義
第2章 エグゼクティブサマリー
第3章 産業洞察
- エコシステム分析
- サプライヤーの状況
- 公共交通事業者
- 技術プロバイダー
- システムインテグレーター
- エンドユーザー
- 利益率分析
- 技術の差別化
- リアルタイムデータ分析
- 車両間通信
- 電気自動車とサステイナブルモビリティソリューション
- 非接触決済ソリューション
- その他
- 主要ニュースと取り組み
- 特許分析
- 規制状況
- 影響要因
- 促進要因
- 都市交通渋滞の増加
- 公共旅客におけるデジタル化の進展
- 政府によるインフラ投資
- モビリティ嗜好の変化
- 産業の潜在的リスク・課題
- 規制標準化の課題
- 高額な初期インフラ投資
- 促進要因
- 成長可能性分析
- ポーター分析
- PESTEL分析
第4章 競合情勢
- イントロダクション
- 企業シェア分析
- 競合のポジショニングマトリックス
- 戦略展望マトリックス
第5章 市場推定・予測:コンポーネント別、2021~2034年
- 主要動向
- ハードウェア
- センサ
- ディスプレイパネル
- 通信機器
- 車載コンピュータ
- その他
- ソフトウェア
- サービス
- プロフェッショナルサービス
- マネージドサービス
第6章 市場推定・予測:技術別、2021~2034年
- 主要動向
- リアルタイム旅客情報システム
- 自動車両位置情報(AVL)
- コンピューター支援配車(CAD)
- 電子決済システム(EPS)
- 旅客情報システム(PIS)
第7章 市場推定・予測:用途別、2021~2034年
- 主要動向
- 交通管理
- 車両管理
- 旅客の安全とセキュリティ
- 発券ソリューション
- 公共情報発信
第8章 市場推定・予測:旅客手段別、2021~2034年
- 主要動向
- 道路
- 鉄道
- 空路
- 水路
第9章 市場推定・予測:地域別、2021~2034年
- 主要動向
- 北米
- 米国
- カナダ
- 欧州
- 英国
- ドイツ
- フランス
- スペイン
- イタリア
- ロシア
- 北欧
- アジア太平洋
- 中国
- インド
- 日本
- 韓国
- ニュージーランド
- 東南アジア
- ラテンアメリカ
- ブラジル
- メキシコ
- アルゼンチン
- 中東・アフリカ
- アラブ首長国連邦
- 南アフリカ
- サウジアラビア
第10章 企業プロファイル
- Alstom
- Bombardier
- CAF
- Cisco
- Conduent Transportation
- CRRC
- Cubic Transportation Systems
- EasyMile
- Garmin
- Hitachi Rail
- Huawei
- Indra
- Kapsch
- New Flyer
- Parsons
- Raytheon
- Siemens
- Stadler
- Thales Group
- Transdev
- Trapeze
- Volvo
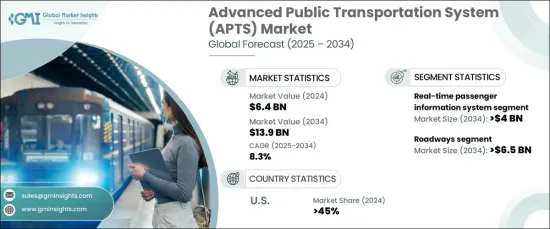
The Global Advanced Public Transportation System Market was valued at USD 6.4 billion in 2024 and is expected to experience impressive growth, with a CAGR of 8.3% from 2025 to 2034. This growth is largely driven by increasing government investments in smart transportation solutions and the shift toward sustainable urban mobility. A key factor behind this expansion is the growing demand for smarter cities, which prioritize reducing carbon emissions, improving public transport efficiency, and offering innovative solutions to enhance urban mobility.
The APTS market spans several technology-driven segments, including real-time passenger information systems, Automated Vehicle Location (AVL), computer-aided dispatch, Electronic Payment Systems (EPS), and Passenger Information Systems (PIS). Among these, the real-time passenger information systems segment held a dominant 30% share in 2024 and is projected to generate USD 4 billion by 2034. These advanced systems leverage artificial intelligence and machine learning to deliver predictive analytics, improving the passenger experience. By analyzing both historical and real-time data, these systems forecast demand, optimize transportation routes, and identify congestion hotspots, ultimately enhancing service delivery and efficiency.
| Market Scope | |
|---|---|
| Start Year | 2024 |
| Forecast Year | 2025-2034 |
| Start Value | $6.4 Billion |
| Forecast Value | $13.9 Billion |
| CAGR | 8.3% |
In terms of transportation modes, the APTS market is divided into roadways, railways, airways, and waterways. The roadways segment is expected to reach USD 6.5 billion by 2034, driven by several emerging trends. Many cities are investing in specialized roadways designed for autonomous public transport, equipped with dedicated lanes, advanced sensor networks, and intelligent traffic systems. These smart corridors are tailored to prioritize autonomous vehicles like buses and shuttles, integrating vehicle-to-infrastructure (V2I) communication to alleviate congestion, boost safety, and ensure more predictable travel times. This fusion of cutting-edge technology with thoughtful urban planning is set to streamline mobility and enhance the overall efficiency of transportation systems.
In the U.S., the APTS market held a significant 45% share in 2024. U.S. cities are leading the charge in deploying autonomous electric shuttle services, particularly in controlled environments such as airports, campuses, and business districts. These AI-powered shuttles are helping to address labor shortages, reduce operational costs, and improve both safety and efficiency. Prominent tech hubs in the U.S. are at the forefront of this innovation, focusing on minimizing human error and advancing the development of smart urban mobility infrastructure. This concentrated effort has positioned the U.S. as a dominant player in the global APTS market.
Table of Contents
Chapter 1 Methodology & Scope
- 1.1 Research design
- 1.1.1 Research approach
- 1.1.2 Data collection methods
- 1.2 Base estimates and calculations
- 1.2.1 Base year calculation
- 1.2.2 Key trends for market estimates
- 1.3 Forecast model
- 1.4 Primary research & validation
- 1.4.1 Primary sources
- 1.4.2 Data mining sources
- 1.5 Market definitions
Chapter 2 Executive Summary
- 2.1 Industry 3600 synopsis, 2021 - 2034
Chapter 3 Industry Insights
- 3.1 Industry ecosystem analysis
- 3.2 Supplier landscape
- 3.2.1 Public transportation operators
- 3.2.2 Technology providers
- 3.2.3 System integrators
- 3.2.4 End users
- 3.3 Profit margin analysis
- 3.4 Technology differentiators
- 3.4.1 Real-time data analytics
- 3.4.2 Vehicle-to-infrastructure communication
- 3.4.3 Electric and sustainable mobility solutions
- 3.4.4 Contactless payment solutions
- 3.4.5 Others
- 3.5 Key news & initiatives
- 3.6 Patent analysis
- 3.7 Regulatory landscape
- 3.8 Impact forces
- 3.8.1 Growth drivers
- 3.8.1.1 Growth in urban traffic congestion
- 3.8.1.2 Emerging digitization in public transportation fleets
- 3.8.1.3 Infrastructure investments by governments
- 3.8.1.4 Changing mobility preferences
- 3.8.2 Industry pitfalls & challenges
- 3.8.2.1 Regulatory standardization challenges
- 3.8.2.2 High initial infrastructure investment
- 3.8.1 Growth drivers
- 3.9 Growth potential analysis
- 3.10 Porter’s analysis
- 3.11 PESTEL analysis
Chapter 4 Competitive Landscape, 2024
- 4.1 Introduction
- 4.2 Company market share analysis
- 4.3 Competitive positioning matrix
- 4.4 Strategic outlook matrix
Chapter 5 Market Estimates & Forecast, By Component, 2021 - 2034 ($Bn)
- 5.1 Key trends
- 5.2 Hardware
- 5.2.1 Sensors
- 5.2.2 Display panels
- 5.2.3 Communication devices
- 5.2.4 Onboard computers
- 5.2.5 Others
- 5.3 Software
- 5.4 Services
- 5.4.1 Professional services
- 5.4.2 Managed services
Chapter 6 Market Estimates & Forecast, By Technology, 2021 - 2034 ($Bn)
- 6.1 Key trends
- 6.2 Real-time passenger information system
- 6.3 Automated Vehicle Location (AVL)
- 6.4 Computer-aided dispatch (CAD)
- 6.5 Electronic Payment Systems (EPS)
- 6.6 Passenger Information Systems (PIS)
Chapter 7 Market Estimates & Forecast, By Application, 2021 - 2034 ($Bn)
- 7.1 Key trends
- 7.2 Traffic management
- 7.3 Fleet management
- 7.4 Passenger safety & security
- 7.5 Ticketing solutions
- 7.6 Public information dissemination
Chapter 8 Market Estimates & Forecast, By Mode of Transportation, 2021 - 2034 ($Bn)
- 8.1 Key trends
- 8.2 Roadways
- 8.3 Railways
- 8.4 Airways
- 8.5 Waterways
Chapter 9 Market Estimates & Forecast, By Region, 2021 - 2034 ($Bn)
- 9.1 Key trends
- 9.2 North America
- 9.2.1 U.S.
- 9.2.2 Canada
- 9.3 Europe
- 9.3.1 UK
- 9.3.2 Germany
- 9.3.3 France
- 9.3.4 Spain
- 9.3.5 Italy
- 9.3.6 Russia
- 9.3.7 Nordics
- 9.4 Asia Pacific
- 9.4.1 China
- 9.4.2 India
- 9.4.3 Japan
- 9.4.4 South Korea
- 9.4.5 ANZ
- 9.4.6 Southeast Asia
- 9.5 Latin America
- 9.5.1 Brazil
- 9.5.2 Mexico
- 9.5.3 Argentina
- 9.6 MEA
- 9.6.1 UAE
- 9.6.2 South Africa
- 9.6.3 Saudi Arabia
Chapter 10 Company Profiles
- 10.1 Alstom
- 10.2 Bombardier
- 10.3 CAF
- 10.4 Cisco
- 10.5 Conduent Transportation
- 10.6 CRRC
- 10.7 Cubic Transportation Systems
- 10.8 EasyMile
- 10.9 Garmin
- 10.10 Hitachi Rail
- 10.11 Huawei
- 10.12 Indra
- 10.13 Kapsch
- 10.14 New Flyer
- 10.15 Parsons
- 10.16 Raytheon
- 10.17 Siemens
- 10.18 Stadler
- 10.19 Thales Group
- 10.20 Transdev
- 10.21 Trapeze
- 10.22 Volvo
