
ガソリンスタンド機器市場の機会、成長促進要因、産業動向分析、2024~2032年の予測
Gas Station Equipment Market Opportunity, Growth Drivers, Industry Trend Analysis, and Forecast 2024 - 2032- 発行日
- ページ情報
- 英文 225 Pages
- 納期
- 2~3営業日
- 商品コード
- 1665061
- カスタマイズ可能 お客様のご希望に応じて、既存データの加工や未掲載情報(例:国別セグメント)の追加などの対応が可能です。詳細はお問い合わせください。
- 翻訳ツール提供対象 PDF対応AI翻訳ツールの無料貸し出しサービスのご利用が可能です
概要
世界のガソリンスタンド機器市場は、2023年に71億米ドルと評価され、2024年から2032年にかけてCAGR 4.7%で拡大し、着実な成長が見込まれています。
この成長の原動力となっているのは、高度な燃料供給システムとエネルギー効率の高い技術に対する需要の高まりです。二酸化炭素排出量削減への関心が高まるにつれ、圧縮天然ガス(CNG)、水素、電気自動車(EV)充電ステーションなどの代替燃料へのシフトが顕著になっています。この移行により、ガソリンスタンド事業者は、消費者の嗜好の変化に対応するため、最先端のディスペンシング機器、革新的な貯蔵システム、統合ソフトウェア・ソリューションを導入してインフラを近代化する必要に迫られています。
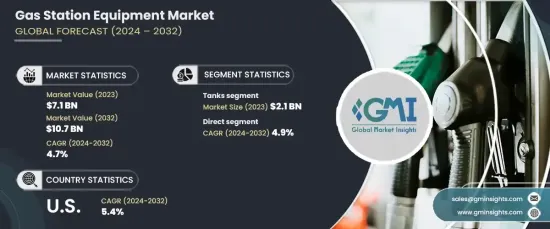
市場はタイプ別にタンク、燃料ディスペンサー、ノズル、ポンプ、ホース、タイヤ空気入れ、コンビニエンスストア(Cストア)機器、その他関連製品に区分されます。なかでもタンクが最大のシェアを占め、2023年には21億米ドルの貢献となります。予測期間中のCAGRは4.6%と予測されています。タンクは燃料の貯蔵と安全性の確保に不可欠であり、ガソリンスタンドの運営に欠かせないものとなっています。規制の遵守を保証し、環境リスクを最小限に抑えるその能力は、市場での優位性を強化しています。
| 市場範囲 | |
|---|---|
| 開始年 | 2023 |
| 予測年 | 2024-2032 |
| 開始金額 | 71億米ドル |
| 予測金額 | 107億米ドル |
| CAGR | 4.7% |
流通チャネルの観点から、市場は直接セグメントと間接セグメントに分けられます。2023年時点では直接セグメントが52.6%のシェアを占めて市場をリードしており、2032年までのCAGRは4.9%と予想されています。直接販売チャネルは、メーカーとエンドユーザーとの間に強固な関係を築くことができるため、好まれています。このアプローチにより、オーダーメイドのソリューション、迅速な納品、より良いアフターサービスが可能になります。さらに、メーカーにリアルタイムのフィードバックを提供し、継続的な改善と顧客満足度の向上を可能にします。
米国のガソリンスタンド機器市場は2023年に14億米ドルを生み出し、2032年までのCAGRは5.4%と堅調な成長が予測されています。同国の確立された給油インフラと高い自動車保有率が、同市場の優位性に寄与しています。最先端の燃料補給技術への継続的な投資とEV充電ネットワークの拡大が、同国の市場成長をさらに押し上げると思われます。
目次
第1章 調査手法と調査範囲
- 市場範囲と定義
- 基本推定と計算
- 予測パラメータ
- データソース
- 1次データ
- 2次データ
- 有料情報源
- 公的情報源
第2章 エグゼクティブサマリー
第3章 業界洞察
- エコシステム分析
- バリューチェーンに影響を与える要因
- 利益率分析
- 破壊
- 将来の展望
- メーカー
- 流通業者
- サプライヤーの状況
- 利益率分析
- 主要ニュースと取り組み
- 規制状況
- 技術的展望
- 影響要因
- 促進要因
- 代替燃料とEV充電インフラの採用増加。
- 燃料ディスペンサーと自動化システムの技術的進歩。
- エネルギー効率が高く、環境に優しい機器に対する需要の高まり。
- 交通網の拡大と都市化
- 業界の潜在的リスク&課題
- 高い初期投資とメンテナンス費用。
- 規制遵守と環境への懸念
- 促進要因
- 成長可能性分析
- ポーターの分析
- PESTEL分析
第4章 競合情勢
- イントロダクション
- 企業シェア分析
- 競合のポジショニング・マトリックス
- 戦略展望マトリックス
第5章 市場推計・予測:タイプ別、2021年~2032年
- 主要動向
- タンク
- 燃料ディスペンサー
- ノズル
- ポンプ
- ホース
- タイヤ空気入れ
- C店舗設備
- その他(ポンプフィルターなど)
第6章 市場推計・予測:燃料タイプ別、2021年~2032年
- 主要動向
- ガソリン
- ディーゼル
- バイオ燃料
- 圧縮天然ガス(CNG)
- 液化天然ガス(LNG)
- 水素燃料
- その他
第7章 市場推計・予測:最終用途別、2021年~2032年
- 主要動向
- 小売ガソリンスタンド
- 商業フリート
- 航空
- 船舶
- 軍用
第8章 市場推計・予測:流通チャネル別、2021年~2032年
- 主要動向
- 直接流通
- 間接流通
第9章 市場推計・予測:地域別、2021年~2032年
- 主要動向
- 北米
- 米国
- カナダ
- 欧州
- 英国
- ドイツ
- フランス
- イタリア
- スペイン
- アジア太平洋
- 中国
- 日本
- インド
- オーストラリア
- ラテンアメリカ
- ブラジル
- メキシコ
- 中東・アフリカ
- 南アフリカ
- サウジアラビア
- アラブ首長国連邦
第10章 企業プロファイル
- Beijing Sanki Petroleum Technology
- Bennett Pump Company
- Censtar Science and Technology Corp. Ltd.
- China Hongyang
- Dover Corporation
- Franklin Fueling Systems
- Gilbarco Veeder-Root
- Jiangsu Furen Group
- Korea EnE Co. Ltd.
- Peltek
- Tatsuno Corporation
- Tokheim Group
- U-Fuel Corporate HongYang Group
- VeriFone
- Wayne Fueling Systems
目次
The Global Gas Station Equipment Market was valued at USD 7.1 billion in 2023 and is expected to experience steady growth, expanding at a CAGR of 4.7% from 2024 to 2032. This growth is being driven by the increasing demand for advanced fueling systems and energy-efficient technologies. As the focus on reducing carbon emissions intensifies, there has been a marked shift toward alternative fuels such as compressed natural gas (CNG), hydrogen, and electric vehicle (EV) charging stations. This transition is prompting gas station operators to modernize their infrastructure with cutting-edge dispensing equipment, innovative storage systems, and integrated software solutions to meet the changing preferences of consumers.
The market is segmented by type into tanks, fuel dispensers, nozzles, pumps, hoses, tire inflators, convenience store (C-store) equipment, and other related products. Among these, tanks hold the largest share, contributing USD 2.1 billion in 2023. They are projected to grow at a CAGR of 4.6% over the forecast period. Tanks are crucial for fuel storage and safety, making them an essential part of any gas station operation. Their ability to ensure compliance with regulations and minimize environmental risks reinforces their dominance in the market.
| Market Scope | |
|---|---|
| Start Year | 2023 |
| Forecast Year | 2024-2032 |
| Start Value | $7.1 Billion |
| Forecast Value | $10.7 Billion |
| CAGR | 4.7% |
In terms of distribution channels, the market is divided into direct and indirect segments. The direct segment led the market in 2023, holding a 52.6% share, and is expected to grow at a CAGR of 4.9% through 2032. Direct distribution channels are favored due to their ability to create stronger relationships between manufacturers and end-users. This approach allows for tailored solutions, faster delivery, and better after-sales service. Additionally, it provides manufacturers with real-time feedback, allowing for continuous improvement and enhanced customer satisfaction.
The U.S. gas station equipment market generated USD 1.4 billion in 2023 and is forecast to grow at a robust CAGR of 5.4% through 2032. The country's well-established fueling infrastructure and high vehicle ownership rates contribute to its dominant market position. Ongoing investments in cutting-edge fueling technologies, along with the expansion of EV charging networks, will further boost its market growth.
Table of Contents
Chapter 1 Methodology & Scope
- 1.1 Market scope & definition
- 1.2 Base estimates & calculations
- 1.3 Forecast parameters
- 1.4 Data sources
- 1.4.1 Primary
- 1.5 Secondary
- 1.5.1 Paid sources
- 1.5.2 Public sources
Chapter 2 Executive Summary
- 2.1 Industry synopsis, 2021 - 2032
Chapter 3 Industry Insights
- 3.1 Industry ecosystem analysis
- 3.1.1 Factor affecting the value chain
- 3.1.2 Profit margin analysis
- 3.1.3 Disruptions
- 3.1.4 Future outlook
- 3.1.5 Manufacturers
- 3.1.6 Distributors
- 3.2 Supplier landscape
- 3.3 Profit margin analysis
- 3.4 Key news & initiatives
- 3.5 Regulatory landscape
- 3.6 Technological landscape
- 3.7 Impact forces
- 3.7.1 Growth drivers
- 3.7.1.1 Increasing adoption of alternative fuels and EV charging infrastructure.
- 3.7.1.2 Technological advancements in fuel dispensing and automation systems.
- 3.7.1.3 Rising demand for energy-efficient and eco-friendly equipment.
- 3.7.1.4 Expanding transportation networks and urbanization
- 3.7.2 Industry pitfalls & challenges
- 3.7.2.1 High initial investment and maintenance costs.
- 3.7.2.2 Regulatory compliance and environmental concerns
- 3.7.1 Growth drivers
- 3.8 Growth potential analysis
- 3.9 Porter’s analysis
- 3.10 PESTEL analysis
Chapter 4 Competitive Landscape, 2023
- 4.1 Introduction
- 4.2 Company market share analysis
- 4.3 Competitive positioning matrix
- 4.4 Strategic outlook matrix
Chapter 5 Market Estimates and Forecast, By Type, 2021 – 2032 (USD Billion) (Thousand units)
- 5.1 Key trends
- 5.2 Tanks
- 5.3 Fuel dispensers
- 5.4 Nozzles
- 5.5 Pumps
- 5.6 Hoses
- 5.7 Tire inflators
- 5.8 C-Store equipment
- 5.9 Others (pump filters, etc.)
Chapter 6 Market Estimates and Forecast, By Fuel Type, 2021 – 2032 (USD Billion) (Thousand units)
- 6.1 Key trends
- 6.2 Gasoline
- 6.3 Diesel
- 6.4 Biofuel
- 6.5 Compressed Natural Gas (CNG)
- 6.6 Liquefied Natural Gas (LNG)
- 6.7 Hydrogen fueling
- 6.8 Others
Chapter 7 Market Estimates and Forecast, By End Use, 2021 – 2032 (USD Billion) (Thousand units)
- 7.1 Key trends
- 7.2 Retail gas stations
- 7.3 Commercial fleets
- 7.4 Aviation
- 7.5 Marine
- 7.6 Military
Chapter 8 Market Estimates & Forecast, By Distribution Channel, 2021 – 2032, (USD Billion) (Thousand units)
- 8.1 Key trends
- 8.2 Direct
- 8.3 Indirect
Chapter 9 Market Estimates & Forecast, By Region, 2021 – 2032, (USD Billion) (Thousand units)
- 9.1 Key trends
- 9.2 North America
- 9.2.1 U.S.
- 9.2.2 Canada
- 9.3 Europe
- 9.3.1 UK
- 9.3.2 Germany
- 9.3.3 France
- 9.3.4 Italy
- 9.3.5 Spain
- 9.4 Asia Pacific
- 9.4.1 China
- 9.4.2 Japan
- 9.4.3 India
- 9.4.4 Australia
- 9.5 Latin America
- 9.5.1 Brazil
- 9.5.2 Mexico
- 9.6 MEA
- 9.6.1 South Africa
- 9.6.2 Saudi Arabia
- 9.6.3 UAE
Chapter 10 Company Profiles (Business Overview, Financial Data, Product Landscape, Strategic Outlook, SWOT Analysis)
- 10.1 Beijing Sanki Petroleum Technology
- 10.2 Bennett Pump Company
- 10.3 Censtar Science and Technology Corp. Ltd.
- 10.4 China Hongyang
- 10.5 Dover Corporation
- 10.6 Franklin Fueling Systems
- 10.7 Gilbarco Veeder-Root
- 10.8 Jiangsu Furen Group
- 10.9 Korea EnE Co. Ltd.
- 10.10 Peltek
- 10.11 Tatsuno Corporation
- 10.12 Tokheim Group
- 10.13 U-Fuel Corporate HongYang Group
- 10.14 VeriFone
- 10.15 Wayne Fueling Systems
- 発行日
- 発行
- Global Market Insights Inc.
- ページ情報
- 英文 225 Pages
- 納期
- 2~3営業日


