
|
市場調査レポート
商品コード
1664856
ライセンス玩具の市場機会、成長促進要因、産業動向分析、2024年~2032年予測Licensed Toy Market Opportunity, Growth Drivers, Industry Trend Analysis, and Forecast 2024 - 2032 |
||||||
カスタマイズ可能
|
|||||||
| ライセンス玩具の市場機会、成長促進要因、産業動向分析、2024年~2032年予測 |
|
出版日: 2024年12月03日
発行: Global Market Insights Inc.
ページ情報: 英文 220 Pages
納期: 2~3営業日
|

全表示
- 概要
- 目次
世界のライセンス玩具市場は、2023年に289億米ドルとなり、2024年から2032年にかけてCAGR4.7%で堅調に成長すると予測されています。
拡張現実(AR)、仮想現実(VR)、人工知能(AI)などの技術革新は、ライセンス玩具の不可欠な要素になりつつあり、その双方向性と魅力を高めています。こうした技術主導の玩具は、しばしば有名フランチャイズと関連付けられ、今日の技術に精通した消費者の関与を高め、需要を押し上げています。
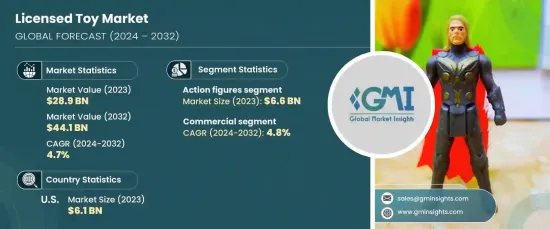
ライセンス玩具市場は製品タイプ別に区分され、アクションフィギュア、人形・ぬいぐるみ、図画工作、ゲーム・パズル、アウトドア・スポーツ玩具、工作セット、知育玩具などが含まれます。このうち、アクションフィギュア分野は2023年に66億米ドルと評価され、2024年から2032年にかけて5.4%のCAGRで力強い成長が見込まれています。アクションフィギュアの不朽の人気は、しばしば成功した映画フランチャイズ、テレビ番組、ビデオゲームと結びついているため、消費者の関心は絶えることがありません。高品質で収集可能なアクションフィギュアに注力する企業は、引き続き愛好家向けのサービスを提供し、この分野の収益創出に大きく貢献しています。
| 市場範囲 | |
|---|---|
| 開始年 | 2023年 |
| 予測年 | 202年~2032年 |
| 開始金額 | 289億米ドル |
| 予測金額 | 441億米ドル |
| CAGR | 4.7% |
最終用途の観点から、ライセンス玩具市場は個人向けと商業向けに分類されます。商業セグメントは2023年に市場シェアの56%を占め、2024年から2032年までの成長率は4.8%と予測されます。大手小売チェーンや玩具専門店は、ライセンス玩具の流通において重要な役割を果たしており、広く入手できるようにし、これらの垂涎の的となる製品のための一等地の棚スペースを確保しています。さらに、エンターテインメントフランチャイズとのコラボレーションは、独占的な製品発売をもたらすことが多く、商業部門での需要をさらに押し上げています。多くの人気フランチャイズは、テーマパークのアトラクションやイベントの商品の中核として、ライセンス玩具を戦略的に使用しています。
米国のライセンス玩具市場は2023年に61億米ドルとなり、2032年までCAGR4.8%で成長すると予測されています。大手エンターテインメント企業の本拠地である米国は、特に人気フランチャイズに関連した新コンテンツのリリース時には、ライセンス玩具の中心的な拠点であり続けています。熱心なコレクターコミュニティやファンコンベンションの存在が、ライセンス商品への需要を牽引し続け、ダイナミックで進化し続ける市場を形成しています。米国はライセンス玩具市場の重要なプレーヤーであるだけでなく、業界の世界のシフトに影響を与えるトレンドセッターでもあります。
目次
第1章 調査手法と調査範囲
- 市場範囲と定義
- 基本推定と計算
- 予測計算
- データソース
- 一次
- 二次
- 有料情報源
- 公的情報源
第2章 エグゼクティブサマリー
第3章 業界洞察
- 業界エコシステム分析
- バリューチェーンに影響を与える要因
- 利益率分析
- 変革
- 将来の展望
- メーカー
- 流通業者
- サプライヤーの状況
- 利益率分析
- 主要ニュースと取り組み
- 規制状況
- 影響要因
- 成長促進要因
- フランチャイズ玩具とキャラクター玩具の人気
- 知育玩具とSTEM玩具への注目
- 業界の潜在的リスク・課題
- 高いライセンシングコスト
- 成長促進要因
- 成長可能性分析
- ポーター分析
- PESTEL分析
第4章 競合情勢
- イントロダクション
- 企業市場シェア分析
- 競合のポジショニングマトリックス
- 戦略展望マトリックス
第5章 市場推計・予測:製品タイプ別、2021年~2032年
- 主要動向
- アクションフィギュア
- 人形・ぬいぐるみ
- アート・クラフト
- ゲーム・パズル
- アウトドア・スポーツ玩具
- 工作セット
- 知育玩具
- その他(乗り物など)
第6章 市場推計・予測:価格帯別、2021年~2032年
- 主要動向
- 低
- 中
- 高
第7章 市場推計・予測:年齢層別、2021年~2032年
- 主要動向
- 1歳未満
- 1~3歳
- 3~5歳
- 5~12歳
- 12歳以上
第8章 市場推計・予測:最終用途別、2021年~2032年
- 主要動向
- 個人用
- 業務用
第9章 市場推計・予測:流通チャネル別、2021年~2032年
- 主要動向
- オンライン
- eコマースサイト
- 自社サイト
- オフライン
- ハイパーマーケット・スーパーマーケット
- 百貨店
- 専門店
- その他小売店
第10章 市場推計・予測:地域別、2021年~2032年
- 主要動向
- 北米
- 米国
- カナダ
- 欧州
- 英国
- ドイツ
- フランス
- イタリア
- スペイン
- ロシア
- アジア太平洋
- 中国
- インド
- 日本
- 韓国
- オーストラリア
- ラテンアメリカ
- ブラジル
- メキシコ
- 中東・アフリカ
- UAE
- サウジアラビア
- 南アフリカ
第11章 企業プロファイル
- Bandai Namco Holdings Inc.
- Basic Fun!
- Fisher-Price(Division of Mattel)
- Funko Inc.
- Hasbro Inc.
- JAKKS Pacific Inc.
- LEGO Group
- Mattel Inc.
- Mega Brands Inc.(Owned by Mattel)
- Melissa &Doug LLC
- Playmobil(Brand of Geobra Brandstätter Stiftung & Co. KG)
- Ravensburger AG
- Spin Master Corp.
- Tomy Company Ltd.
- VTech Holdings Ltd.
The Global Licensed Toy Market was valued at USD 28.9 billion in 2023 and is projected to grow at a robust compound annual growth rate (CAGR) of 4.7% from 2024 to 2032. Innovations in technology, including augmented reality (AR), virtual reality (VR), and artificial intelligence (AI), are becoming essential components of licensed toys, enhancing their interactivity and appeal. These tech-driven toys, often associated with well-known franchises, are fueling greater engagement and driving up demand among today's tech-savvy consumers.
The licensed toy market is segmented by product type, which includes action figures, dolls and plush toys, arts and crafts, games and puzzles, outdoor and sports toys, construction sets, educational toys, and more. Among these, the action figures segment was valued at USD 6.6 billion in 2023 and is expected to grow at a strong CAGR of 5.4% from 2024 to 2032. The enduring popularity of action figures, often tied to successful movie franchises, TV shows, and video games, ensures a constant flow of consumer interest. Companies focusing on high-quality, collectible action figures continue to cater to enthusiasts, significantly contributing to the sector's revenue generation.
| Market Scope | |
|---|---|
| Start Year | 2023 |
| Forecast Year | 2024-2032 |
| Start Value | $28.9 Billion |
| Forecast Value | $44.1 Billion |
| CAGR | 4.7% |
From an end-use perspective, the licensed toy market is divided into individual and commercial categories. The commercial segment held 56% of the market share in 2023 and is anticipated to experience a growth rate of 4.8% from 2024 to 2032. Large retail chains and specialty toy stores play a crucial role in the distribution of licensed toys, ensuring widespread availability and securing prime shelf space for these coveted products. Moreover, collaborations with entertainment franchises often result in exclusive product launches, further boosting demand in the commercial sector. Many popular franchises strategically use licensed toys as a core part of their merchandise for theme park attractions and events.
The U.S. licensed toy market was valued at USD 6.1 billion in 2023 and is projected to grow at a CAGR of 4.8% through 2032. As the home of major entertainment companies, the U.S. remains a central hub for licensed toys, particularly during the release of new content tied to popular franchises. The presence of avid collector communities and fan conventions continues to drive demand for licensed products, creating a dynamic and ever-evolving market. The U.S. is not only a key player in the licensed toy market but also a trendsetter, influencing global shifts in the industry.
Table of Contents
Chapter 1 Methodology & Scope
- 1.1 Market scope & definitions
- 1.2 Base estimates & calculations
- 1.3 Forecast calculations.
- 1.4 Data sources
- 1.4.1 Primary
- 1.4.2 Secondary
- 1.4.2.1 Paid sources
- 1.4.2.2 Public sources
Chapter 2 Executive Summary
- 2.1 Industry synopsis, 2021-2032
Chapter 3 Industry Insights
- 3.1 Industry ecosystem analysis
- 3.1.1 Factor affecting the value chain
- 3.1.2 Profit margin analysis
- 3.1.3 Disruptions
- 3.1.4 Future outlook
- 3.1.5 Manufacturers
- 3.1.6 Distributors
- 3.2 Supplier landscape
- 3.3 Profit margin analysis
- 3.4 Key news & initiatives
- 3.5 Regulatory landscape
- 3.6 Impact forces
- 3.6.1 Growth drivers
- 3.6.1.1 Popularity of franchise and character-based toys
- 3.6.1.2 Focus on educational and STEM toys
- 3.6.2 Industry pitfalls & challenges
- 3.6.2.1 High licensing costs
- 3.6.1 Growth drivers
- 3.7 Growth potential analysis
- 3.8 Porter’s analysis
- 3.9 PESTEL analysis
Chapter 4 Competitive Landscape, 2023
- 4.1 Introduction
- 4.2 Company market share analysis
- 4.3 Competitive positioning matrix
- 4.4 Strategic outlook matrix
Chapter 5 Market Estimates & Forecast, By Product Type, 2021-2032 (USD Billion) (Billion Units)
- 5.1 Key trends
- 5.2 Action figures
- 5.3 Dolls & plush toys
- 5.4 Arts & crafts
- 5.5 Games & puzzles
- 5.6 Outdoor & sports toys
- 5.7 Construction sets
- 5.8 Educational toys
- 5.9 Others (Vehicles, Etc)
Chapter 6 Market Estimates & Forecast, By Price Range, 2021-2032 (USD Billion) (Billion Units)
- 6.1 Key trends
- 6.2 Low
- 6.3 Medium
- 6.4 High
Chapter 7 Market Estimates & Forecast, By Age Group, 2021-2032 (USD Billion) (Billion Units)
- 7.1 Key trends
- 7.2 Below 1 Yrs.
- 7.3 Age 1- 3
- 7.4 Age 3- 5
- 7.5 Age 5- 12
- 7.6 Age 12+
Chapter 8 Market Estimates & Forecast, By End Use, 2021-2032 (USD Billion) (Billion Units)
- 8.1 Key trends
- 8.2 Individual
- 8.3 Commercial
Chapter 9 Market Estimates & Forecast, By Distribution Channel, 2021-2032 (USD Billion) (Billion Units)
- 9.1 Key trends
- 9.2 Online
- 9.2.1 E-Commerce website
- 9.2.2 Company owned website
- 9.3 Offline
- 9.3.1 Hypermarket/Supermarket
- 9.3.2 Departmental stores
- 9.3.3 Specialized stores
- 9.3.4 Other retail stores
Chapter 10 Market Estimates & Forecast, By Region, 2021-2032 (USD Billion) (Billion Units)
- 10.1 Key trends
- 10.2 North America
- 10.2.1 U.S.
- 10.2.2 Canada
- 10.3 Europe
- 10.3.1 UK
- 10.3.2 Germany
- 10.3.3 France
- 10.3.4 Italy
- 10.3.5 Spain
- 10.3.6 Russia
- 10.4 Asia Pacific
- 10.4.1 China
- 10.4.2 India
- 10.4.3 Japan
- 10.4.4 South Korea
- 10.4.5 Australia
- 10.5 Latin America
- 10.5.1 Brazil
- 10.5.2 Mexico
- 10.6 MEA
- 10.6.1 UAE
- 10.6.2 Saudi Arabia
- 10.6.3 South Africa
Chapter 11 Company Profiles
- 11.1 Bandai Namco Holdings Inc.
- 11.2 Basic Fun!
- 11.3 Fisher-Price (Division of Mattel)
- 11.4 Funko Inc.
- 11.5 Hasbro Inc.
- 11.6 JAKKS Pacific Inc.
- 11.7 LEGO Group
- 11.8 Mattel Inc.
- 11.9 Mega Brands Inc. (Owned by Mattel)
- 11.10 Melissa & Doug LLC
- 11.11 Playmobil (Brand of Geobra Brandstätter Stiftung & Co. KG)
- 11.12 Ravensburger AG
- 11.13 Spin Master Corp.
- 11.14 Tomy Company Ltd.
- 11.15 VTech Holdings Ltd.
