
|
市場調査レポート
商品コード
1750567
圧力計の市場機会、成長促進要因、産業動向分析、2025年~2034年予測Pressure Gauges Market Opportunity, Growth Drivers, Industry Trend Analysis, and Forecast 2025 - 2034 |
||||||
カスタマイズ可能
|
|||||||
| 圧力計の市場機会、成長促進要因、産業動向分析、2025年~2034年予測 |
|
出版日: 2025年05月15日
発行: Global Market Insights Inc.
ページ情報: 英文 220 Pages
納期: 2~3営業日
|

全表示
- 概要
- 目次
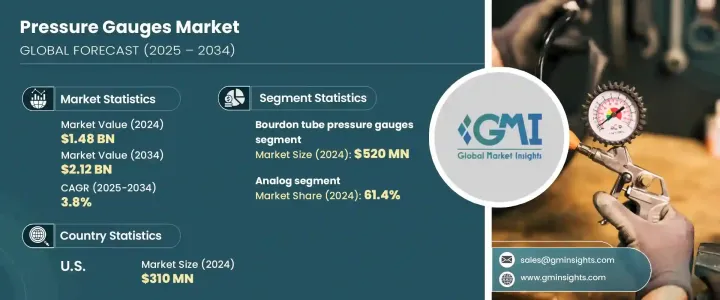
圧力計の世界市場は、2024年には14億8,000万米ドルとなり、CAGR 3.8%で成長し、2034年には21億2,000万米ドルに達すると予測されています。
圧力測定装置に対する需要の高まりは、石油・ガス、化学生産、発電、自動車製造などの産業分野における開発の加速が大きな要因となっています。これらの分野では、操業の安全性、効率性、規制遵守を確保するために、機器やシステム内の圧力を一貫して正確に監視することが重要です。各業界で業務の自動化が進むにつれ、信頼性が高く統合された圧力モニタリング・ソリューションの必要性がさらに高まっています。これらのセクターを支える技術インフラは急速に進化しており、プロセスの完全性を維持し、機器の故障に関連するリスクを低減するために、圧力計を含む自動化ツールへの依存度が高まっています。
製造施設、製油所、その他の産業環境では、作業効率と機械の保護が重視されています。圧力計は、重大なダウンタイムや高価な損害につながる過圧を防止することにより、これらの基準を維持する上で極めて重要な役割を果たしています。新興経済圏、特にアジア太平洋とラテンアメリカでは、産業活動の活発化によって需要がさらに高まっています。産業基盤が拡大している国では、重機械や製油所の主要な消費者となりつつあり、それに伴って高度な圧力監視ソリューションのニーズが高まっています。
| 市場範囲 | |
|---|---|
| 開始年 | 2024年 |
| 予測年 | 2025~2034年 |
| 開始金額 | 14億8,000万米ドル |
| 予測金額 | 21億2,000万米ドル |
| CAGR | 3.8% |
インダストリー4.0の進展により、スマートテクノロジーの統合が進み、圧力計市場は大きく変化しています。IoTに対応した圧力計は、リアルタイムのデータ追跡、予知保全、分析に基づくパフォーマンス洞察などの機能を提供するようになりました。これらのデバイスは、特に正確さとプロセスの最適化が不可欠な分野で、急速なペースで採用されています。生産性の向上、ダウンタイムの削減、遠隔地からの自動モニタリングなどの機能を備えたスマート圧力計は、高性能なモニタリングツールを必要とする幅広い産業で不可欠なものとなりつつあります。
技術別では、ブルドン管、ダイアフラム、カプセル、アブソリュート、ピエゾメーター、その他ベローズ、マノメーター、差動圧力計などに分類されます。2024年には、ブルドン管圧力計セグメントが約5億2,000万米ドルの収益で市場をリードし、予測期間中のCAGRは約4%で成長すると予測されています。ブルドン管ゲージは、その堅牢な設計と過酷な動作条件に耐える能力により、引き続き支持されています。その機械的構造により、過酷な環境でも信頼性の高い性能を発揮できるため、幅広い産業用途に適しています。これらのゲージは、その長寿命、低メンテナンスコスト、そして電子式の代替品が故障するような厳しい条件下でも効果的に機能する能力が評価されています。
製品タイプにより、世界市場はアナログとデジタルに分けられます。アナログゲージは、ブルドン管とダイアフラムタイプを含み、2024年の市場シェアの約61.4%を占め、2034年までのCAGRは3.5%と予測されています。デジタルゲージは、その精度とスマートシステムとの互換性から支持を集めており、CAGR 4.1%で成長していますが、アナログゲージは、その機械的信頼性、費用対効果、電子部品の追加コストなしに大規模な展開を必要とする産業での広範な応用から、引き続き優位を占めています。シンプルな設計で耐久性に優れているため、手頃な価格と業務効率を重視する産業にとって理想的です。
米国は北米の圧力計市場をリードし、2024年の評価額は3億1,000万米ドルに達し、2025年から2034年までのCAGRは3.9%以上で成長すると予測されています。同国の強力な産業基盤と、老朽化したインフラをアップグレードする継続的なニーズが、この成長の主な要因となっています。圧力測定システムは、エネルギー、製造、水処理、その他の主要分野のアプリケーションにとって引き続き重要です。機械式圧力計は、特に産業界が厳しい安全基準と性能基準を満たす信頼性の高いソリューションを求める中、その信頼性の高い性能とコスト優位性により、広く使用され続けています。
圧力計市場は非常に細分化されており、多くのプレーヤーが多種多様な製品を提供しています。コストに敏感な地域では、価格ベースの競争が特に激しく、利益率に下方圧力がかかっています。メーカー各社は、産業用アプリケーションの進化する要件に合わせた次世代の圧力計を開発するため、研究開発に多額の投資を行って対応しています。企業はまた、新興市場でより大きなシェアを獲得するために、製品のイノベーションと地理的拡大に注力しています。変化する市場力学に素早く適応し、差別化されたソリューションを提供する能力は、この競合情勢における成長の重要な要因であり続けています。
目次
第1章 調査手法と範囲
第2章 エグゼクティブサマリー
第3章 業界考察
- エコシステム分析
- バリューチェーンに影響を与える要因
- 利益率分析
- ディスラプション
- 将来の展望
- 製造業者
- 販売代理店
- トランプ政権の関税分析
- 貿易への影響
- 貿易量の混乱
- 報復措置
- 業界への影響
- 供給側の影響(原材料)
- 主要原材料の価格変動
- サプライチェーンの再構築
- 生産コストへの影響
- 需要側の影響(販売価格)
- 最終市場への価格伝達
- 市場シェアの動向
- 消費者の反応パターン
- 影響を受ける主要企業
- 戦略的な業界対応
- サプライチェーンの再構成
- 価格設定と製品戦略
- 政策関与
- 展望と今後の検討事項
- 貿易への影響
- サプライヤーの情勢
- 利益率分析
- 主なニュースと取り組み
- 規制情勢
- 影響要因
- 促進要因
- 工業化と製造業の成長
- 産業用アプリケーションにおける自動化とIoTの需要の高まり
- 圧力センシング技術の技術的進歩
- 業界の潜在的リスク&課題
- プレミアムモデルの初期費用が高め
- 規制上の課題
- 促進要因
- 成長可能性分析
- ポーター分析
- PESTEL分析
第4章 競合情勢
- イントロダクション
- 企業の市場シェア分析
- 競合ポジショニングマトリックス
- 戦略的展望マトリックス
第5章 市場推計・予測:製品タイプ別、2021~2034年
- 主要動向
- アナログ圧力計
- デジタル圧力計
第6章 市場推計・予測:技術別、2021~2034年
- 主要動向
- ブルドン管圧力計
- ダイアフラム圧力計
- カプセル圧力計
- 絶対圧力計
- ピエゾメーター圧力計
- その他(ベローズ、マノメーター、差動装置)
第7章 市場推計・予測:材料別、2021~2034年
- 主要動向
- ステンレス鋼
- 真鍮
- アルミニウム
- プラスチック
- その他(鋼、銅、青銅など)
第8章 市場推計・予測:最終用途別、2021~2034年
- 主要動向
- 化学および石油化学
- 石油・ガス
- エネルギーと電力
- 医薬品
- 水と廃水処理
- その他(航空宇宙、自動車など)
第9章 市場推計・予測:流通チャネル別、2021~2034年
- 主要動向
- オンライン
- オフライン
第10章 市場推計・予測:地域別、2021~2034年
- 主要動向
- 北米
- 米国
- カナダ
- 欧州
- 英国
- ドイツ
- フランス
- イタリア
- スペイン
- ロシア
- アジア太平洋地域
- 中国
- インド
- 日本
- 韓国
- オーストラリア
- インドネシア
- マレーシア
- ラテンアメリカ
- ブラジル
- メキシコ
- 中東・アフリカ
- アラブ首長国連邦
- サウジアラビア
- 南アフリカ
第11章 企業プロファイル
- Ametek
- Badotherm
- Circor
- Dwyer
- Emerson
- Fluke Corporation
- Honeywell International
- Kobold Instruments
- Newbow
- Omega Engineering
- QED Aerospace
- Wika Instruments
- Winters Instruments
The Global Pressure Gauges Market was valued at USD 1.48 billion in 2024 and is estimated to grow at a CAGR of 3.8% to reach USD 2.12 billion by 2034. The growing demand for pressure measurement devices is largely driven by the accelerating development in industrial sectors such as oil and gas, chemical production, power generation, and automotive manufacturing. These sectors rely on consistent and accurate monitoring of pressure within equipment and systems to ensure operational safety, efficiency, and regulatory compliance. As industries continue to automate their operations, the need for reliable and integrated pressure monitoring solutions becomes even more critical. The technological infrastructure supporting these sectors is evolving rapidly, increasing reliance on automation tools, including pressure gauges, to maintain process integrity and reduce risks associated with equipment failure.
Manufacturing facilities, refineries, and other industrial environments are placing heightened emphasis on operational efficiency and machinery protection. Pressure gauges play a pivotal role in maintaining these standards by preventing over-pressurization, which can lead to significant downtime or costly damage. In emerging economies, especially in Asia-Pacific and Latin America, the demand is further intensified by the growing industrial activity. Nations with expanding industrial bases are turning into major consumers of heavy machinery and refinery operations, driving a corresponding increase in the need for advanced pressure monitoring solutions.
| Market Scope | |
|---|---|
| Start Year | 2024 |
| Forecast Year | 2025-2034 |
| Start Value | $1.48 Billion |
| Forecast Value | $2.12 Billion |
| CAGR | 3.8% |
The advancement of Industry 4.0 has transformed the pressure gauges market with the growing integration of smart technologies. Pressure gauges that are IoT-enabled now offer features such as real-time data tracking, predictive maintenance, and analytics-based performance insights. These devices are being adopted at a rapid pace, particularly in sectors where accuracy and process optimization are essential. With capabilities that enhance productivity, reduce downtime, and offer automated monitoring from remote locations, smart pressure gauges are becoming indispensable across a broad range of industries that demand high-performance monitoring tools.
By technology, the market is classified into bourdon tube, diaphragm, capsule, absolute, piezometer, and other types such as bellows, manometers, and differential pressure gauges. In 2024, the bourdon tube pressure gauges segment led the market with revenue of approximately USD 520 million and is projected to grow at a CAGR of around 4% during the forecast period. Bourdon tube gauges continue to be favored due to their robust design and ability to withstand extreme operational conditions. Their mechanical construction allows for reliable performance in harsh environments, making them suitable for a wide range of industrial applications. These gauges are valued for their longevity, low maintenance costs, and the ability to function effectively in demanding conditions where electronic alternatives may falter.
Based on product type, the global market is divided into analog and digital pressure gauges. Analog gauges, which include bourdon tube and diaphragm types, held around 61.4% of the market share in 2024 and are expected to register a CAGR of 3.5% through 2034. Although digital gauges are gaining traction due to their precision and compatibility with smart systems, growing at a CAGR of 4.1%, analog gauges continue to dominate because of their mechanical reliability, cost-effectiveness, and widespread application in industries that require large-scale deployment without the added cost of electronic components. Their simple design and durable nature make them ideal for industries focused on affordability and operational efficiency.
The United States led the North American pressure gauges market, reaching a valuation of USD 310 million in 2024 and forecasted to grow at a CAGR of over 3.9% from 2025 to 2034. The country's strong industrial base and the ongoing need to upgrade aging infrastructure are major factors contributing to this growth. Pressure measurement systems remain critical for applications across energy, manufacturing, water treatment, and other key sectors. Mechanical pressure gauges continue to be widely used due to their dependable performance and cost advantages, particularly as industries seek reliable solutions that meet strict safety and performance standards.
The pressure gauges market remains highly fragmented, with numerous players offering a wide variety of products. In cost-sensitive regions, price-based competition is especially intense, placing downward pressure on profit margins. Manufacturers are responding by investing heavily in R&D to create next-generation pressure gauges tailored to the evolving requirements of industrial applications. Companies are also focusing on product innovation and geographic expansion to capture a larger share of emerging markets. The ability to adapt quickly to changing market dynamics and deliver differentiated solutions remains a key factor for growth in this competitive landscape.
Table of Contents
Chapter 1 Methodology & Scope
- 1.1 Market scope & definitions
- 1.2 Base estimates & calculations
- 1.3 Forecast calculations.
- 1.4 Data sources
- 1.4.1 Primary
- 1.4.2 Secondary
- 1.4.2.1 Paid sources
- 1.4.2.2 Public sources
Chapter 2 Executive Summary
- 2.1 Industry synopsis, 2021-2034
Chapter 3 Industry Insights
- 3.1 Industry ecosystem analysis
- 3.1.1 Factor affecting the value chain.
- 3.1.2 Profit margin analysis.
- 3.1.3 Disruptions
- 3.1.4 Future outlook
- 3.1.5 Manufacturers
- 3.1.6 Distributors
- 3.2 Trump administration tariffs analysis
- 3.2.1 Impact on trade
- 3.2.1.1 Trade volume disruptions
- 3.2.1.2 Retaliatory measures
- 3.2.2 Impact on the industry
- 3.2.2.1 Supply-side impact (raw materials)
- 3.2.2.2 Price volatility in key materials
- 3.2.2.3 Supply chain restructuring
- 3.2.2.4 Production cost implications
- 3.2.2.5 Demand-side impact (selling price)
- 3.2.2.6 Price transmission to end markets
- 3.2.2.7 Market share dynamics
- 3.2.2.8 Consumer response patterns
- 3.2.3 Key companies impacted
- 3.2.4 Strategic industry responses
- 3.2.4.1 Supply chain reconfiguration
- 3.2.4.2 Pricing and product strategies
- 3.2.4.3 Policy engagement
- 3.2.5 Outlook and future considerations
- 3.2.1 Impact on trade
- 3.3 Supplier landscape
- 3.4 Profit margin analysis.
- 3.5 Key news & initiatives
- 3.6 Regulatory landscape
- 3.7 Impact forces
- 3.7.1 Growth drivers
- 3.7.1.1 Industrialization and manufacturing growth
- 3.7.1.2 Rising demand for automation and IoT in industrial applications
- 3.7.1.3 Technological advancements in pressure sensing technology
- 3.7.2 Industry pitfalls & challenges
- 3.7.2.1 High initial cost of premium models
- 3.7.2.2 Regulatory challenges
- 3.7.1 Growth drivers
- 3.8 Growth potential analysis
- 3.9 Porter's analysis
- 3.10 PESTEL analysis
Chapter 4 Competitive Landscape, 2024
- 4.1 Introduction
- 4.2 Company market share analysis
- 4.3 Competitive positioning matrix
- 4.4 Strategic outlook matrix
Chapter 5 Market Estimates & Forecast, By Product Type, 2021-2034 (USD Billion) (Thousand Units)
- 5.1 Key trends
- 5.2 Analog pressure gauges
- 5.3 Digital pressure gauges
Chapter 6 Market Estimates & Forecast, By Technology, 2021-2034 (USD Billion) (Thousand Units)
- 6.1 Key trends
- 6.2 Bourdon tube pressure gauges
- 6.3 Diaphragm pressure gauges
- 6.4 Capsule pressure gauges
- 6.5 Absolute pressure gauges
- 6.6 Piezometer pressure gauge
- 6.7 Others (Bellows, manometer, differential)
Chapter 7 Market Estimates & Forecast, By Material, 2021-2034 (USD Billion) (Thousand Units)
- 7.1 Key trends
- 7.2 Stainless steel
- 7.3 Brass
- 7.4 Aluminum
- 7.5 Plastic
- 7.6 Others (steel, copper, bronze etc.)
Chapter 8 Market Estimates & Forecast, By End Use, 2021-2034 (USD Billion) (Thousand Units)
- 8.1 Key trends
- 8.2 Chemical & petrochemical
- 8.3 Oil & gas
- 8.4 Energy & power
- 8.5 Pharmaceutical
- 8.6 Water & wastewater treatment
- 8.7 Others (aerospace, automotive, etc.)
Chapter 9 Market Estimates & Forecast, By Distribution Channel, 2021-2034 (USD Billion) (Thousand Units)
- 9.1 Key trends
- 9.2 Online
- 9.3 Offline
Chapter 10 Market Estimates & Forecast, By Region, 2021-2034 (USD Billion) (Thousand Units)
- 10.1 Key trends
- 10.2 North America
- 10.2.1 U.S.
- 10.2.2 Canada
- 10.3 Europe
- 10.3.1 UK
- 10.3.2 Germany
- 10.3.3 France
- 10.3.4 Italy
- 10.3.5 Spain
- 10.3.6 Russia
- 10.4 Asia Pacific
- 10.4.1 China
- 10.4.2 India
- 10.4.3 Japan
- 10.4.4 South Korea
- 10.4.5 Australia
- 10.4.6 Indonesia
- 10.4.7 Malaysia
- 10.5 Latin America
- 10.5.1 Brazil
- 10.5.2 Mexico
- 10.6 MEA
- 10.6.1 UAE
- 10.6.2 Saudi Arabia
- 10.6.3 South Africa
Chapter 11 Company Profiles
- 11.1 Ametek
- 11.2 Badotherm
- 11.3 Circor
- 11.4 Dwyer
- 11.5 Emerson
- 11.6 Fluke Corporation
- 11.7 Honeywell International
- 11.8 Kobold Instruments
- 11.9 Newbow
- 11.10 Omega Engineering
- 11.11 QED Aerospace
- 11.12 Wika Instruments
- 11.13 Winters Instruments

