
|
市場調査レポート
商品コード
1913349
デジタル変電所の市場機会、成長要因、業界動向分析、および2026年から2035年までの予測Digital Substation Market Opportunity, Growth Drivers, Industry Trend Analysis, and Forecast 2026 - 2035 |
||||||
カスタマイズ可能
|
|||||||
| デジタル変電所の市場機会、成長要因、業界動向分析、および2026年から2035年までの予測 |
|
出版日: 2025年12月23日
発行: Global Market Insights Inc.
ページ情報: 英文 145 Pages
納期: 2~3営業日
|

概要
世界のデジタル変電所市場は、2025年に89億米ドルと評価され、2035年までにCAGR6.8%で成長し、173億米ドルに達すると予測されています。
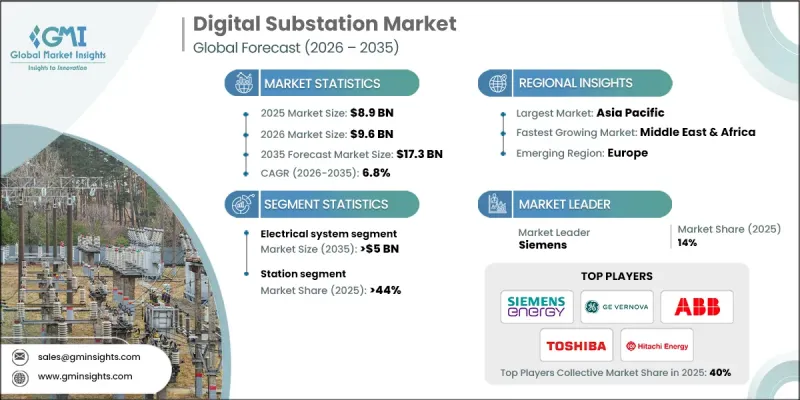
電力会社や産業オペレーターが先進的で信頼性の高いインテリジェントな送配電網インフラを優先する中、市場は着実に拡大しています。デジタル変電所は、継続的なデータ可視化、自動制御、状態監視に基づく保守を可能にすることで、従来の変電所の置き換えや近代化を加速させています。この移行は、電力消費量の増加を支えると同時に、送配電網の安定性と運用効率の向上に貢献しています。デジタル変電所は、標準化された通信アーキテクチャ、高速データ伝送、接続デバイスを活用し、相互運用性を高めるとともに物理的な配線要件を大幅に削減します。リアルタイム分析、デジタルモデリング、サイバーセキュリティフレームワークの統合により、システムの耐障害性が強化され、停電リスクが低減されます。分散型発電や複雑なエネルギーフローの管理に不可欠なデジタル変電所は、スマートグリッド開発への投資拡大に伴い、導入が加速し続けております。発展途上地域における急速な都市拡大と産業成長は、大規模なグリッド更新と送電網拡張をさらに推進しております。これらの要因が相まって、世界中の公益事業、再生可能エネルギー統合プロジェクト、エネルギー集約型産業において、デジタル変電所に対する強力な長期的需要が創出されております。
| 市場範囲 | |
|---|---|
| 開始年 | 2025年 |
| 予測年度 | 2026-2035 |
| 開始時価値 | 89億米ドル |
| 予測金額 | 173億米ドル |
| CAGR | 6.8% |
電気システム分野は、2035年までに50億米ドル規模に達すると予測されております。この分野は、変圧器、遮断器、高電圧アセンブリなど、変電所の基盤となるハードウェアを表しております。デジタル環境においては、これらの資産には高度なセンシング技術や信号変換技術が搭載されており、精密な計測、迅速な保護応答、インテリジェント制御システムとのシームレスな通信を可能とし、変電所全体の性能向上に寄与しております。
2025年時点で44.8%のシェアを占めるステーションセグメントは、2035年までCAGR6%で拡大すると予測されています。このセグメントはデジタル変電所の構造的基盤を形成し、一次設備がインテリジェント電子機器と直接連携する場となります。物理信号をデジタルデータストリームに変換することで、継続的な監視、迅速な故障検出、運用透明性の向上を実現します。
米国デジタル変電所市場は2035年までに15億米ドル規模に達すると予測されています。同国における市場成長は、送電網近代化への持続的な投資、電力需要の増加、信頼性と効率性向上のための老朽化した送配電インフラ更新への重点的な取り組みによって支えられています。
よくあるご質問
目次
第1章 調査手法と範囲
第2章 エグゼクティブサマリー
第3章 業界考察
- エコシステム分析
- 原材料の入手可能性に関する状況
- バリューチェーンに影響を与える要因
- ディスラプション
- 規制情勢
- 業界への影響要因
- 促進要因
- 業界の潜在的リスク&課題
- 成長可能性分析
- ポーター分析
- PESTEL分析
- 新たな機会と動向
- 投資分析と将来展望
第4章 競合情勢
- イントロダクション
- 地域別における当社の市場シェア
- 北米
- 欧州
- アジア太平洋地域
- 中東・アフリカ
- ラテンアメリカ
- 戦略的取り組み
- 競合ベンチマーキングの図解
- 戦略ダッシュボード
- イノベーションと技術動向
第5章 市場規模・予測:コンポーネント別、2022-2035
- デジタル変電所自動化システム
- 通信ネットワーク
- 電気システム
- 変圧器
- 母線
- 保護装置
- 遮断器
- 保護継電器
- 開閉装置
- 監視・制御システム
- ヒューマンマシンインターフェース
- プログラマブルロジックコントローラ
- その他
- その他
第6章 市場規模・予測:アーキテクチャ別、2022-2035
- プロセス
- ベイ
- ステーション
第7章 市場規模・予測:用途別、2022-2035
- 送電
- 配電
第8章 市場規模・予測:接続方式別、2022-2035
- 33kV以下
- 33kV超~110kV以下
- 110kV超~220kV以下
- 220kV超~550kV以下
- 550kV超
第9章 市場規模・予測:電圧レベル別、2022-2035
- 低電圧
- 中電圧
- 高
第10章 市場規模・予測:最終用途別、2022-2035
- 公益事業
- 産業用
第11章 市場規模・予測:設備別、2022-2035
- 新規
- 再生品
第12章 市場規模・予測:地域別、2022-2035
- 北米
- 米国
- カナダ
- メキシコ
- 欧州
- 英国
- フランス
- ドイツ
- イタリア
- ロシア
- スペイン
- アジア太平洋地域
- 中国
- オーストラリア
- インド
- 日本
- 韓国
- 中東・アフリカ
- サウジアラビア
- アラブ首長国連邦
- トルコ
- 南アフリカ
- エジプト
- ラテンアメリカ
- ブラジル
- アルゼンチン
第13章 企業プロファイル
- ABB
- Belden Inc
- Bharat Heavy Electricals Limited
- Cisco Systems
- Eaton
- GE Vernova
- NovaTech.
- OMICRON
- Ponovo Power
- Redeia
- Schneider Electric
- Siemens Energy
- Toshiba Energy Systems &Solutions
- WEG

