
|
市場調査レポート
商品コード
1766354
吸着装置の市場機会、成長促進要因、産業動向分析、2025~2034年予測Adsorption Equipment Market Opportunity, Growth Drivers, Industry Trend Analysis, and Forecast 2025 - 2034 |
||||||
カスタマイズ可能
|
|||||||
| 吸着装置の市場機会、成長促進要因、産業動向分析、2025~2034年予測 |
|
出版日: 2025年06月12日
発行: Global Market Insights Inc.
ページ情報: 英文 220 Pages
納期: 2~3営業日
|

全表示
- 概要
- 目次
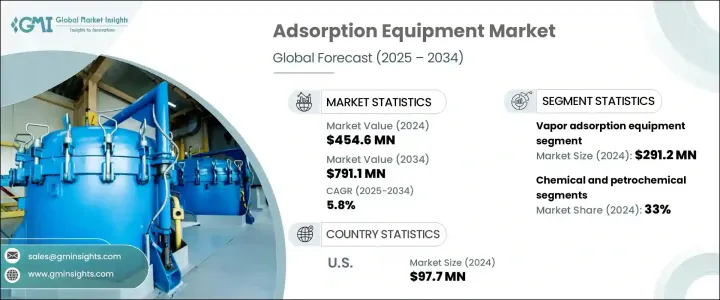
吸着装置の世界市場は、2024年には4億5,460万米ドルとなり、CAGR 5.8%で成長し、2034年には7億9,110万米ドルに達すると予測されています。
この市場の急成長の背景には、環境規制の厳格化と、清潔な水と空気に対するニーズの高まりがあります。一般的に水処理に使用される活性炭システムは、毒素、有機化合物、重金属の除去に不可欠です。これらのシステムは、自治体の水処理や、飲食品製造を含む様々な産業用途で特に重要です。医薬品や食品加工などの産業における高品質の水や原料の需要は、吸着装置市場をさらに牽引しています。技術の進歩もこの成長に重要な役割を果たしています。有機金属骨格(MOF)や高度活性炭のような技術革新は、吸着プロセスをより効率的でコスト効率の高いものにしています。
特に大気や水質が重要な産業において環境保護が重視されるようになっていることが、高度吸着材料の普及を後押ししています。これらの材料は優れた性能を提供するだけでなく、コストを削減しながら作業効率を高めています。汚染防止に関する規制が強化されるにつれて、産業は遵守基準を満たすためにより効果的なソリューションに目を向けています。サステイナブル実践へのシフトは、エネルギー消費を抑え、廃棄物の発生を減らして最適な結果をもたらす吸着材の採用をメーカーに促しています。さらに、吸着技術の進歩により、産業は資源回収を改善し、排出を最小限に抑えることが可能になり、これらの高性能材料の需要をさらに押し上げています。
| 市場範囲 | |
|---|---|
| 開始年 | 2024年 |
| 予測年 | 2025~2034年 |
| 開始金額 | 4億5,460万米ドル |
| 予測金額 | 7億9,110万米ドル |
| CAGR | 5.8% |
蒸気吸着装置セグメントは、2024年に2億9,120万米ドルを生み出し、今後10年間の推定成長率は5.9%です。この装置は、産業用空気や排気システムから揮発性化合物やガスを除去するために不可欠であり、空気浄化やVOC除去に応用されています。特に汚染された都市部では、より清浄な空気へのニーズが高まっており、蒸気吸着システムの需要を押し上げています。自動車、医薬品、製造業などの産業では、こうした技術への依存度が高まっています。
化学・石油化学セグメントは2024年に33%のシェアを占め、2025~2034年にかけてCAGR 6.2%で成長すると予想されています。吸着は、ガスの分離、有用物質の回収、排出ガスの削減を支援することにより、これらの産業で重要な役割を果たしています。圧力スイング吸着(PSA)や真空スイング吸着(VSA)のような技術は、天然ガス処理やバイオガス改良においてますます普及しており、ガス分離の効率を向上させています。
米国の吸着装置2024年の市場規模は9,770万米ドルで、2025~2034年までの推定成長率は5.7%です。市場拡大の原動力となっているのは、EPAのような機関による厳しい環境規制であり、大気や水質基準を遵守するために吸着ベースのシステムを採用するよう産業に働きかけています。さらに、プロセスの最適化、効率化、コスト削減に対する需要の高まりが、こうしたシステムの需要をさらに押し上げています。化学・石油化学セグメント、特に天然ガス処理や溶剤回収などのセグメントが、市場成長の主要因となっています。
吸着装置産業をリードしているのは、Calgon Carbon、Bry-Air、Durr、Evoqua、CECO Environmentalなどの有力企業です。これらの企業は、先進技術への投資や、産業・自治体部門における清浄な空気と水に対する需要の高まりに対応するソリューションの提供を通じて、技術革新を推進し、市場でのプレゼンスを拡大することに注力しています。市場での地位を高めるため、吸着装置産業の企業は様々な戦略を実施しています。その中には、より効率的で費用対効果の高いソリューションを導入するための研究開発への注力も含まれます。さらに、水処理から空気浄化まで、より幅広い産業に対応するため、製品ポートフォリオを拡大しています。戦略的パートナーシップや買収も、能力とリーチを強化するために進められています。企業は競合を維持するため、有機金属骨格や高度吸着材料などの最先端技術に投資しています。
目次
第1章 調査手法と範囲
第2章 エグゼクティブサマリー
第3章 産業考察
- エコシステム分析
- サプライヤーの情勢
- 利益率
- 各段階での付加価値
- バリューチェーンに影響を与える要因
- ディスラプション
- 産業への影響要因
- 促進要因
- 産業の潜在的リスク・課題
- 機会
- 成長可能性分析
- 将来の市場動向
- 技術とイノベーションの情勢
- 現在の技術動向
- 新興技術
- 価格動向
- 地域別
- 製品タイプ別
- 規制の枠組み
- 規格と認証
- 環境規制
- 輸出入規制
- ポーターのファイブフォース分析
- PESTEL分析
第4章 競合情勢
- イントロダクション
- 企業の市場シェア分析
- 地域別
- 企業マトリックス分析
- 主要市場企業の競合分析
- 競合ポジショニングマトリックス
- 合併と買収
- パートナーシップとコラボレーション
- 新製品の発売
- 拡大計画
第5章 市場推定・予測:製品タイプ別、2021~2034年
- 主要動向
- 蒸気吸着装置
- 液体吸着装置
第6章 市場推定・予測:流量別、2021~2034年
- 主要動向
- 最大1万CFM
- 1万~2万CFM
- 2万CFM以上
第7章 市場推定・予測:最終用途産業別、2021~2034年
- 主要動向
- 医薬品
- 廃棄物と廃水処理
- 化学・石油化学
- 自動車
- 印刷
- その他(農薬、コーティング等)
第8章 市場推定・予測:流通チャネル別、2021~2034年
- 主要動向
- 直接販売
- 間接販売
第9章 市場推定・予測:地域別、2021~2034年
- 主要動向
- 北米
- 米国
- カナダ
- 欧州
- 英国
- ドイツ
- フランス
- イタリア
- スペイン
- ロシア
- アジア太平洋
- 中国
- インド
- 日本
- 韓国
- オーストラリア
- ラテンアメリカ
- ブラジル
- メキシコ
- 中東・アフリカ
- アラブ首長国連邦
- サウジアラビア
- 南アフリカ
第10章 企業プロファイル
- Bry-Air
- Calgon Carbon
- Carbtrol
- CECO Environmental
- Durr
- Evoqua
- General Carbon
- GUNT
- KCH
- Microtrac
- Munters
- Process Combustion Corporation
- Suny Group
- Thermax
- TIGG
The Global Adsorption Equipment Market was valued at USD 454.6 million in 2024 and is estimated to grow at a CAGR of 5.8% to reach USD 791.1 million by 2034. The rapid growth in this market can be attributed to stricter environmental regulations and the increasing need for clean water and air. Activated carbon systems, commonly used for water treatment, are essential for removing toxins, organic compounds, and heavy metals. These systems are particularly important for municipal water treatment and various industrial applications, including food and beverage production. The demand for high-quality water and raw materials in industries like pharmaceuticals and food processing is further driving the market for adsorption equipment. Technological advancements are also playing a significant role in this growth. Innovations like metal-organic frameworks (MOFs) and advanced activated carbon are making adsorption processes more efficient and cost-effective.
The growing emphasis on environmental protection, particularly in industries where air and water quality are critical, is driving the widespread use of advanced adsorption materials. These materials not only offer superior performance but also enhance operational efficiency while reducing costs. As regulations around pollution control tighten, industries are turning to more effective solutions to meet compliance standards. The shift toward sustainable practices is pushing manufacturers to adopt adsorbents that deliver optimal results with lower energy consumption and reduced waste generation. Furthermore, advancements in adsorption technologies are enabling industries to improve resource recovery and minimize emissions, further boosting the demand for these high-performance materials.
| Market Scope | |
|---|---|
| Start Year | 2024 |
| Forecast Year | 2025-2034 |
| Start Value | $454.6 Million |
| Forecast Value | $791.1 Million |
| CAGR | 5.8% |
The vapor adsorption equipment segment generated USD 291.2 million in 2024, with an estimated growth rate of 5.9% over the next decade. This equipment is essential for removing volatile compounds and gases from industrial air and exhaust systems, with applications in air purification and VOC removal. The growing need for cleaner air, especially in polluted urban areas, is pushing the demand for vapor adsorption systems. Industries such as automotive, pharmaceuticals, and manufacturing are increasing their reliance on these technologies.
The chemical and petrochemical segment accounted for a 33% share in 2024 and is expected to grow at a CAGR of 6.2% between 2025 and 2034. Adsorption plays a vital role in these industries by helping with the separation of gases, the recovery of useful materials, and the reduction of emissions. Technologies like pressure swing adsorption (PSA) and vacuum swing adsorption (VSA) are becoming increasingly popular in natural gas processing and biogas upgrading, offering improved efficiency in gas separation.
U.S. Adsorption Equipment Market was valued at USD 97.7 million in 2024, with an estimated growth rate of 5.7% from 2025 to 2034. The market's expansion is being driven by stringent environmental regulations from bodies like the EPA, which are encouraging industries to adopt adsorption-based systems to comply with air and water quality standards. Additionally, the increasing demand for process optimization, efficiency, and cost reduction is further fueling the demand for these systems. The chemical and petrochemical sectors, particularly in areas like natural gas processing and solvent recovery, are key contributors to market growth.
Several prominent players are leading the Adsorption Equipment Industry, including Calgon Carbon, Bry-Air, Durr, Evoqua, and CECO Environmental. These companies are focused on driving innovation and expanding their market presence by investing in advanced technologies and offering solutions that meet the growing demands for clean air and water in the industrial and municipal sectors. To enhance their market position, companies in the adsorption equipment industry are implementing various strategies. These include focusing on research and development to introduce more efficient and cost-effective solutions. Additionally, they are expanding their product portfolios to cater to a wider range of industries, from water treatment to air purification. Strategic partnerships and acquisitions are also being pursued to strengthen their capabilities and reach. Companies are investing in state-of-the-art technologies like metal-organic frameworks and advanced adsorption materials to maintain their competitive edge.
Table of Contents
Chapter 1 Methodology & Scope
- 1.1 Market scope and definition
- 1.2 Research design
- 1.2.1 Research approach
- 1.2.2 Data collection methods
- 1.3 Data mining sources
- 1.3.1 Global
- 1.3.2 Regional/Country
- 1.4 Base estimates and calculations
- 1.4.1 Base year calculation
- 1.4.2 Key trends for market estimation
- 1.5 Primary research and validation
- 1.5.1 Primary sources
- 1.6 Forecast model
- 1.7 Research assumptions and limitations
Chapter 2 Executive Summary
- 2.1 Industry 3600 synopsis
- 2.2 Key market trends
- 2.2.1 Regional
- 2.2.2 Product type
- 2.2.3 Flow rate
- 2.2.4 End use industry
- 2.2.5 Distribution channel
- 2.3 CXO perspectives: Strategic imperatives
- 2.3.1 Key decision points for industry executives
- 2.3.2 Critical success factors for market players
- 2.4 Future outlook and strategic recommendations
Chapter 3 Industry Insights
- 3.1 Industry ecosystem analysis
- 3.1.1 Supplier Landscape
- 3.1.2 Profit Margin
- 3.1.3 Value addition at each stage
- 3.1.4 Factor affecting the value chain
- 3.1.5 Disruptions
- 3.2 Industry impact forces
- 3.2.1 Growth drivers
- 3.2.2 Industry pitfalls & challenges
- 3.2.3 Opportunities
- 3.3 Growth potential analysis
- 3.4 Future market trends
- 3.5 Technology and Innovation landscape
- 3.5.1 Current technological trends
- 3.5.2 Emerging technologies
- 3.6 Price trends
- 3.6.1 By region
- 3.6.2 By product type
- 3.7 Regulatory framework
- 3.7.1 Standards and certifications
- 3.7.2 Environmental regulations
- 3.7.3 Import export regulations
- 3.8 Porter's five forces analysis
- 3.9 PESTEL analysis
Chapter 4 Competitive Landscape, 2024
- 4.1 Introduction
- 4.2 Company market share analysis
- 4.2.1 By region
- 4.2.1.1 North America
- 4.2.1.2 Europe
- 4.2.1.3 Asia Pacific
- 4.2.1.4 Latin America
- 4.2.1.5 Middle East and Africa
- 4.2.1 By region
- 4.3 Company matrix analysis
- 4.4 Competitive analysis of major market players
- 4.5 Competitive positioning matrix
- 4.6 Key developments
- 4.6.1 Mergers & acquisitions
- 4.6.2 Partnerships & collaborations
- 4.6.3 New product launches
- 4.6.4 Expansion plans
Chapter 5 Market Estimates & Forecast, By Product Type, 2021 - 2034 (USD Million) (Thousand Units)
- 5.1 Key trends
- 5.2 Vapor adsorption equipment.
- 5.3 Liquid adsorption equipment
Chapter 6 Market Estimates & Forecast, By Flow Rate, 2021 - 2034 (USD Million) (Thousand Units)
- 6.1 Key trends
- 6.2 Up to 10,000 CFM
- 6.3 10,000 - 20,000 CFM
- 6.4 More than 20,000 CFM
Chapter 7 Market Estimates & Forecast, By End Use Industry, 2021 - 2034 (USD Million) (Thousand Units)
- 7.1 Key trends
- 7.2 Pharmaceutical
- 7.3 Waste & wastewater treatment.
- 7.4 Chemical and Petrochemical
- 7.5 Automotive
- 7.6 Printing
- 7.7 Others (pesticide, coating etc.)
Chapter 8 Market Estimates & Forecast, By Distribution Channel, 2021 - 2034 (USD Million) (Thousand Units)
- 8.1 Key trends
- 8.2 Direct sales
- 8.3 Indirect sales
Chapter 9 Market Estimates & Forecast, By Region, 2021-2034 (USD Million) (Thousand Units)
- 9.1 Key trends
- 9.2 North America
- 9.2.1 U.S.
- 9.2.2 Canada
- 9.3 Europe
- 9.3.1 UK
- 9.3.2 Germany
- 9.3.3 France
- 9.3.4 Italy
- 9.3.5 Spain
- 9.3.6 Russia
- 9.4 Asia Pacific
- 9.4.1 China
- 9.4.2 India
- 9.4.3 Japan
- 9.4.4 South Korea
- 9.4.5 Australia
- 9.5 Latin America
- 9.5.1 Brazil
- 9.5.2 Mexico
- 9.6 MEA
- 9.6.1 UAE
- 9.6.2 Saudi Arabia
- 9.6.3 South Africa
Chapter 10 Company Profiles
- 10.1 Bry-Air
- 10.2 Calgon Carbon
- 10.3 Carbtrol
- 10.4 CECO Environmental
- 10.5 Durr
- 10.6 Evoqua
- 10.7 General Carbon
- 10.8 GUNT
- 10.9 KCH
- 10.10 Microtrac
- 10.11 Munters
- 10.12 Process Combustion Corporation
- 10.13 Suny Group
- 10.14 Thermax
- 10.15 TIGG

