
|
市場調査レポート
商品コード
1913393
自動車用ナイトビジョンシステム市場:市場機会、成長促進要因、産業動向分析、将来予測(2026~2035年)Automotive Night Vision System Market Opportunity, Growth Drivers, Industry Trend Analysis, and Forecast 2026 - 2035 |
||||||
カスタマイズ可能
|
|||||||
| 自動車用ナイトビジョンシステム市場:市場機会、成長促進要因、産業動向分析、将来予測(2026~2035年) |
|
出版日: 2025年12月31日
発行: Global Market Insights Inc.
ページ情報: 英文 240 Pages
納期: 2~3営業日
|

概要
世界の自動車用ナイトビジョンシステム市場は、2025年に40億米ドルと評価され、2035年までにCAGR 12.2%で成長し、122億米ドルに達すると予測されています。
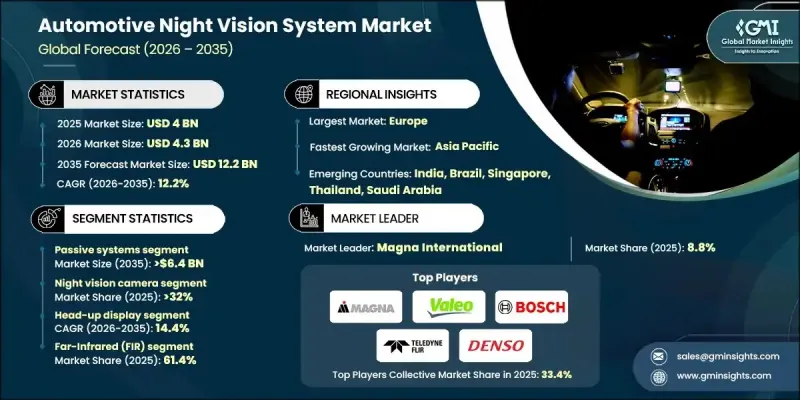
市場拡大の背景には、事故防止への関心の高まりと、現代車両におけるインテリジェント安全技術の統合が進んでいることが挙げられます。電気自動車および自動運転車プラットフォームの進歩が導入をさらに加速させており、ナイトビジョンシステムは広範な安全アーキテクチャを補完する役割を果たしています。低照度運転環境における視認性の課題に対する認識の高まりが、高級車と中価格帯車両の両方で需要を強化しています。先進安全技術に対する規制上の奨励策は、メーカーが包括的な運転支援システムに暗視機能を組み込む形で間接的に普及を後押ししています。赤外線センシング技術、熱画像精度の向上、リアルタイムデータ処理の進展が継続的に進み、信頼性と実用性が向上していることから、これらのシステムは純正装備としての統合においてますます魅力的となっています。これらの要因が相まって、ナイトビジョンシステムは次世代自動車安全戦略における重要な構成要素としての地位を確立しつつあります。
| 市場範囲 | |
|---|---|
| 開始年 | 2025年 |
| 予測期間 | 2026~2035年 |
| 当初の市場規模 | 40億米ドル |
| 市場規模予測 | 122億米ドル |
| CAGR | 12.2% |
パッシブナイトビジョンシステムのセグメントは2025年に46%のシェアを占め、2035年までに64億米ドルの価値に達すると予測されています。このセグメントは、外部光源に依存せずに熱パターンを検出できる能力、視認性が厳しい環境でも安定した性能を発揮する点、安全性を重視した車両アプリケーションをサポートする点から、引き続き主導的な地位を維持しています。
暗視カメラのセグメントは2025年に32%のシェアを占め、推定市場規模は13億米ドルでした。画像の鮮明さ、検知精度、システム耐久性における継続的な改善により、幅広い運転条件下での性能信頼性が向上し、自動車メーカーによる採用拡大を支えています。
米国の自動車用ナイトビジョンシステム市場は2025年に7億6,100万米ドルに達し、2026年から2035年にかけて力強い成長が見込まれます。米国市場における勢いは、先進安全機能に対する消費者の選好と、高付加価値車種カテゴリーにおける知能化車両技術の普及拡大によって支えられています。
よくあるご質問
目次
第1章 分析手法と範囲
第2章 エグゼクティブサマリー
第3章 業界考察
- 業界のエコシステム分析
- サプライヤーの情勢
- 利益率分析
- コスト構造
- 各段階における付加価値
- バリューチェーンに影響を与える要因
- ディスラプション
- 業界への影響要因
- 促進要因
- 道路安全と事故削減への関心の高まり
- ADAS(先進運転支援システム)に対する規制支援の強化
- 赤外線センサーおよび処理技術の進歩
- 自動車におけるプレミアム安全機能への需要の高まり
- デジタルコックピットおよびヘッドアップディスプレイの拡大
- 業界の潜在的リスクと課題
- ナイトビジョンシステム部品の高コスト
- システム統合と調整の複雑性
- 市場機会
- 中級乗用車への普及
- 自動運転および準自動運転システムとの統合
- 電気自動車およびソフトウェア定義車両の成長
- 新興自動車市場における需要の拡大
- 促進要因
- 成長可能性分析
- 規制情勢
- 北米
- 米国-FMVSS(連邦自動車安全基準)
- カナダ-CMVSS
- 欧州
- 英国-UNECE自動車規制
- ドイツ-ISO 26262機能安全
- フランス-UNECE R152
- イタリア-ISO 14001環境マネジメントシステム
- スペイン-ISO 9001品質マネジメントシステム
- アジア太平洋
- 中国-GB自動車規格
- 日本-ISO 26262機能安全
- インド-AIS自動車規格
- ラテンアメリカ
- ブラジル-CONTRAN自動車規制
- メキシコ-NOM自動車規格
- アルゼンチン-ISO 14001環境マネジメントシステム
- 中東・アフリカ
- アラブ首長国連邦- 国連欧州経済委員会(UNECE)車両規制
- 南アフリカ-ISO 26262機能安全
- サウジアラビア-SASO自動車規格
- 北米
- ポーターのファイブフォース分析
- PESTEL分析
- 技術とイノベーションの動向
- 現在の技術動向
- 新興技術
- コスト内訳分析
- 開発コスト構造
- 研究開発コスト分析
- マーケティング及び販売コスト
- 特許分析
- 持続可能性と環境面
- 持続可能な実践
- 廃棄物削減戦略
- 生産におけるエネルギー効率
- 環境に配慮した取り組み
- 将来の市場展望と機会
- OEMおよびティア1サプライヤーの調達・採用基準
- ナイトビジョン採用におけるOEMの意思決定要因
- コスト対安全価値の評価
- 地域別OEM採用の差異
- ティア1サプライヤー選定基準
- ADASスタック統合とシステムアーキテクチャの役割
- 性能、精度、誤検知のトレードオフ
- 責任、安全性検証及び規制リスク
第4章 競合情勢
- イントロダクション
- 企業別の市場シェア分析
- 地域別
- 北米
- 欧州
- アジア太平洋
- ラテンアメリカ
- 中東・アフリカ
- 地域別
- 主要企業の競合分析
- 競合ポジショニング・マトリックス
- 戦略的展望マトリックス
- 主な動向
- 企業合併・買収 (M&A)
- 事業提携・協力
- 新製品の発売
- 事業拡大計画と資金調達
第5章 市場の推定・予測:製品別(2022~2035年)
- アクティブシステム
- パッシブシステム
- 校正・調整システム
- その他
第6章 市場の推定・予測:コンポーネント別(2022~2035年)
- 暗視カメラ
- 赤外線センサー
- 画像処理・制御ユニット
- ディスプレイモジュール
- 照明ユニット
- ソフトウェア・アルゴリズム
第7章 市場の推定・予測:ディスプレイ別(2022~2035年)
- ヘッドアップディスプレイ (HUD)
- 計器クラスター
- ナビゲーションディスプレイ
- 複合ディスプレイシステム
第8章 市場の推定・予測:技術別(2022~2035年)
- 遠赤外線(FIR)
- 近赤外線(NIR)
第9章 市場の推定・予測:車両別(2022~2035年)
- 乗用車
- セダン
- SUV
- ハッチバック
- 商用車
- 小型商用車(LCV)
- 中型商用車(MCV)
- 大型商用車(HCV)
第10章 市場の推定・予測:用途別(2022~2035年)
- 歩行者検知
- 動物検知
- 障害物・物体検知
- 衝突警報・回避システム
- 運転支援・視認性向上
第11章 市場の推定・予測:販売チャネル別(2022~2035年)
- OEM
- アフターマーケット
第12章 市場の推定・予測:地域別(2022~2035年)
- 北米
- 米国
- カナダ
- 欧州
- ドイツ
- 英国
- フランス
- イタリア
- スペイン
- ロシア
- 北欧諸国
- ポルトガル
- クロアチア
- ベネルクス諸国
- アジア太平洋
- 中国
- インド
- 日本
- オーストラリア
- 韓国
- シンガポール
- タイ
- インドネシア
- ベトナム
- ラテンアメリカ
- ブラジル
- メキシコ
- アルゼンチン
- コロンビア
- 中東・アフリカ
- 南アフリカ
- サウジアラビア
- アラブ首長国連邦
- トルコ
第13章 企業プロファイル
- 国際的企業
- Bosch
- Continental
- Magna International
- Valeo
- DENSO
- ZF Friedrichshafen
- Teledyne FLIR
- Autoliv
- Veoneer
- Panasonic
- 地域企業
- Hella
- Gentex
- Harman International
- Visteon
- Hitachi Astemo
- Mobileye
- Ficosa International
- Hyundai Mobis
- Mitsubishi Electric
- Aptiv
- 新興/ディスラプター企業
- Omnivision Technologies
- Infineon Technologies
- Omron
- Texas Instruments
- Luminar Technologies
- Hikvision Automotive
- Raytron Technology

