
|
市場調査レポート
商品コード
1913407
再利用可能包装市場の機会、成長要因、業界動向分析、および2026年から2035年までの予測Reusable Packaging Market Opportunity, Growth Drivers, Industry Trend Analysis, and Forecast 2026 - 2035 |
||||||
カスタマイズ可能
|
|||||||
| 再利用可能包装市場の機会、成長要因、業界動向分析、および2026年から2035年までの予測 |
|
出版日: 2025年12月17日
発行: Global Market Insights Inc.
ページ情報: 英文 180 Pages
納期: 2~3営業日
|

概要
世界の再利用可能包装市場は、2025年に1,413億米ドルと評価され、2035年までにCAGR 6.2%で成長し、2,580億米ドルに達すると予測されています。
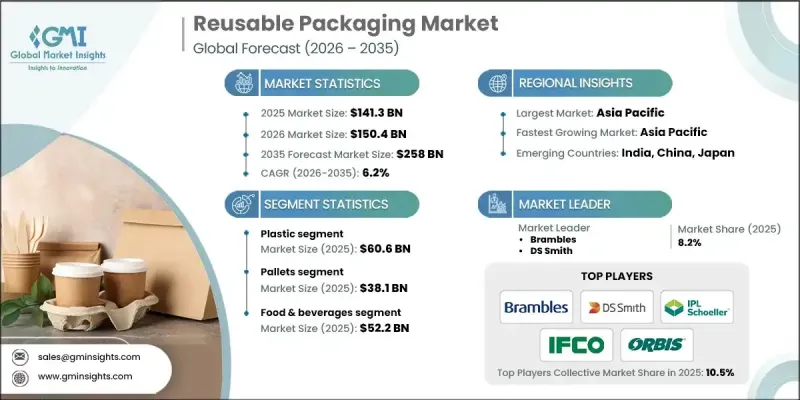
この市場成長は、持続可能な取り組みに対する規制支援の強化、環境に優しい製品への消費者嗜好の高まり、再利用ソリューションによる長期的なコスト削減、電子商取引の拡大、包装デザインの継続的な革新によって推進されています。再利用可能な包装の採用を促す規制は主要な成長要因であり、企業はプラスチック、廃棄物、炭素排出に関する規制への順守がますます求められています。業界リーダーは、規制順守が環境負荷の低減だけでなく、業務効率の向上、ブランド評価の向上、そして業界横断的な再利用可能包装の普及促進にもつながると認識しています。電子商取引の台頭は需要をさらに加速させており、消費者と規制当局がオンライン小売・配送業務において持続可能な包装ソリューションをますます求める中、環境配慮型包装は企業の競争力にとって重要な要素となっています。
| 市場範囲 | |
|---|---|
| 開始年 | 2025年 |
| 予測年度 | 2026-2035 |
| 開始時価値 | 1,413億米ドル |
| 予測金額 | 2,580億米ドル |
| CAGR | 6.2% |
プラスチックセグメントは、その汎用性、コスト効率、食品、飲料、消費財などの業界における適応性により、2025年に606億米ドルに達しました。メーカーは、持続可能な包装ソリューションに対する需要の高まりに対応するため、リサイクル可能な環境に優しいプラスチック代替品の開発と生産プロセスの最適化に注力しています。
パレットセグメントは、世界の貿易の拡大、耐久性のある再利用可能ソリューションへの需要、物流・小売・製造分野における持続可能性への取り組みの強化を背景に、2025年に381億米ドルの市場規模を記録しました。スマート追跡技術やコスト効率の高い設計といったイノベーションは、拡大する再利用可能パレットの需要に応える上で重要な要素です。
米国における再利用可能包装材市場は、2025年に315億米ドル規模に達しました。米国市場の成長は、高い環境意識、廃棄物に関する規制義務、持続可能な製品への消費者需要、そして業界横断的な再利用可能ソリューションの広範な採用によって牽引されています。各社は、消費者の期待に応える頑丈で環境に優しい包装材を提供しつつ、革新的な設計、効率的な生産、環境規制への準拠に注力しています。
よくあるご質問
目次
第1章 調査手法と範囲
第2章 エグゼクティブサマリー
第3章 業界考察
- エコシステム分析
- サプライヤーの情勢
- 利益率
- コスト構造
- 各段階における付加価値
- バリューチェーンに影響を与える要因
- ディスラプション
- 業界への影響要因
- 促進要因
- 持続可能な実践に対する規制支援の強化
- 環境に優しいソリューションに対する消費者需要の高まり
- 再利用可能な選択肢による長期的なコスト削減効果
- 革新的で再利用可能な包装デザインの開発
- 電子商取引(Eコマース)およびオンライン小売の成長
- 業界の潜在的リスク&課題
- 移行企業にとっての初期投資額の高さ
- 再利用可能な包装に対する消費者の抵抗感
- 市場機会
- 消費者の環境意識の高まり
- リサイクル技術の進歩
- 促進要因
- 成長可能性分析
- 規制情勢
- 北米
- 欧州
- アジア太平洋地域
- ラテンアメリカ
- 中東・アフリカ
- ポーター分析
- PESTEL分析
- 技術とイノベーションの動向
- 現在の技術動向
- 新興技術
- 新興ビジネスモデル
- コンプライアンス要件
- 持続可能性対策
- 消費者心理分析
- 地政学的・貿易動向
第4章 競合情勢
- イントロダクション
- 企業の市場シェア分析
- 地域別
- 市場集中度分析
- 主要企業の競合ベンチマーキング
- 財務実績比較
- 収益
- 利益率
- 研究開発
- 製品ポートフォリオ比較
- 製品ラインの幅広さ
- 技術
- イノベーション
- 地域別事業展開比較
- 世界展開分析
- サービスネットワークカバレッジ
- 地域別市場浸透率
- 競合ポジショニングマトリックス
- リーダー企業
- 課題者
- フォロワー
- ニッチプレイヤー
- 戦略的展望マトリックス
- 財務実績比較
- 主な発展, 2021-2024
- 合併・買収
- 提携および協力関係
- 技術的進歩
- 拡大と投資戦略
- サステナビリティへの取り組み
- デジタルトランスフォーメーションの取り組み
- 新興/スタートアップ競合の動向
第5章 市場推計・予測:材料別、2022-2035
- プラスチック
- HDPE
- PP
- PET
- LDPE
- その他
- 金属
- 鋼材
- アルミニウム
- ガラス
- 木材
第6章 市場推計・予測:製品別、2022-2035
- コンテナ
- 中間バルクコンテナ(IBC)
- 折りたたみ式/折り畳み式コンテナ
- バルクボックス
- クレート
- 積み重ね可能なクレート
- 折りたたみ式クレート
- 入れ子式クレート
- ボトル
- パレット
- プラスチックパレット
- 木製パレット
- 金属パレット
- ドラム缶・バレル
- プラスチック製ドラム缶
- 金属ドラム
- その他
第7章 市場推計・予測:最終用途産業別、2022-2035
- 食品・飲料
- 生鮮食品
- 乳製品
- 食肉・水産物
- 飲料
- 製パン・製菓
- その他
- 自動車
- ヘルスケア
- 医薬品
- 医療機器
- 病院向けサプライチェーン
- 物流・運輸
- その他
第8章 市場推計・予測:地域別、2022-2035
- 北米
- 米国
- カナダ
- 欧州
- ドイツ
- 英国
- フランス
- スペイン
- イタリア
- オランダ
- アジア太平洋地域
- 中国
- インド
- 日本
- オーストラリア
- 韓国
- ラテンアメリカ
- ブラジル
- メキシコ
- アルゼンチン
- 中東・アフリカ
- サウジアラビア
- 南アフリカ
- アラブ首長国連邦
第9章 企業プロファイル
- 世界の主要企業
- Brambles
- DS Smith
- IFCO SYSTEMS
- Greif
- 地域別主要企業
- 北米
- Buckhorn Inc
- IPL, Inc.
- Menasha Corporation
- Rehrig Pacific Company
- 欧州
- GWP Group
- Schoeller Allibert
- Schutz GmbH &Co. KGaA
- SSI SCHAEFER
- Asia-Pacific
- Nefab Group
- Plasmix Private Ltd
- 北米
- ディスラプター/ニッチプレイヤー
- Kuehne+Nagel
- Packoorang AS
- noissue
- RePack
- RPP Containers
- Tri-Wall Limited
- Myers Industries

