
|
市場調査レポート
商品コード
1859009
アロマケミカルの市場機会と促進要因、産業動向分析、2025年~2034年予測Aroma Chemicals Market Opportunity, Growth Drivers, Industry Trend Analysis, and Forecast 2025 - 2034 |
||||||
カスタマイズ可能
|
|||||||
| アロマケミカルの市場機会と促進要因、産業動向分析、2025年~2034年予測 |
|
出版日: 2025年10月10日
発行: Global Market Insights Inc.
ページ情報: 英文 210 Pages
納期: 2~3営業日
|

概要
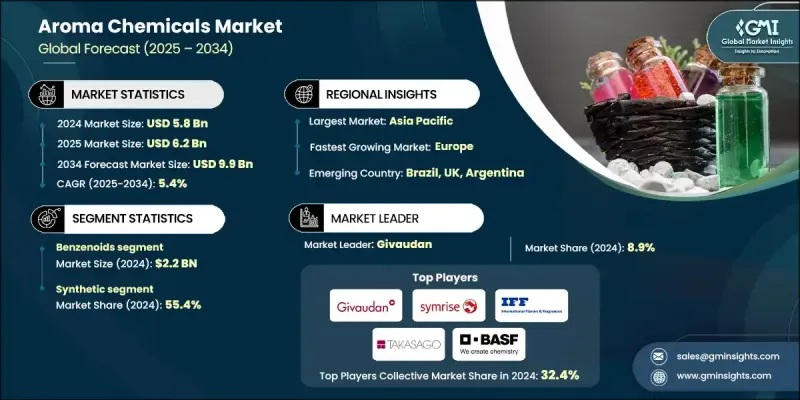
アロマケミカルの世界市場規模は2024年に58億米ドルとなり、CAGR 5.4%で成長し、2034年には99億米ドルに達すると予測されています。
アロマケミカルは、パーソナルケア、家庭用品、食品、飲食品に広く使用されている、フレーバーやフレグランス製剤の中核成分です。香りや味覚体験を形成する役割は、消費者の嗜好や購買行動に強く影響します。市場成長の原動力となっているのは、ライフスタイルの変化、可処分所得の増加、官能主導型製品に対する消費者の需要の高まりです。美容品、グルーミング用品、食用品に至るまで、パーソナライズされた高級品への嗜好の高まりは、洗練されたアロマ化合物への需要を加速させており、メーカーは合成成分と天然成分の両方を使用して、より複雑な香りのプロファイルを開発する必要に迫られています。消費者の期待がよりクリーンで高性能、持続可能な製品へと進化する中、アロマ化学の革新はグローバル市場で競争力を維持し、関連性を保つためにますます不可欠になっています。
| 市場範囲 | |
|---|---|
| 開始年 | 2024 |
| 予測年 | 2025-2034 |
| 市場規模 | 58億米ドル |
| 予測金額 | 99億米ドル |
| CAGR | 5.4% |
2024年、ベンゼノイドセグメントの売上高は22億米ドルでした。フローラルな香りからスパイシーな香りまで、香りの組成におけるベンゼノイドの汎用性は、食品、飲料、パーソナルケア製品に不可欠です。合成法の進歩と高純度のベンゼノイドを大規模に生産できるようになったことで、特に品質を犠牲にすることなくコスト効率を追求するブランドの間で、ベンゼノイドの魅力が高まっています。これらの化合物は厳格な品質基準のもとで製造されるため、幅広い用途で信頼性が高いです。
合成アロマケミカルセグメントは2024年に55.4%のシェアを占め、手頃な価格、信頼できる品質、スケーラブルな生産がその原動力となっています。ラボで製造された化合物は、フレグランスメーカーに香りの特徴を正確にコントロールさせ、化粧品、家庭用品、包装食品などの大量生産産業に理想的です。また、天然原料に比べ生産コストが低く、リードタイムが短く、入手しやすいため、好まれています。
北米アロマケミカル市場の2024年のCAGRは5.3%で、食品加工エコシステムの発達と包装消耗品需要の高まりが背景にあります。同地域のアロマケミカルは、食肉、水産物、乳製品、ベーカリー製品の加工において、風味、食感、保存性を高めるために広く使用されています。リン酸塩ベースの化合物は、全体的な製品性能を向上させながら、規制の食品安全基準を満たすために、様々な食品用途で広く利用されています。消費者の高い意識と相まって、複数の業種にまたがるこの旺盛な需要は、地域の着実な成長を確実なものにしています。
アロマケミカルの世界市場における主要企業には、PFWアロマケミカル(Kelkar Group)、MANE、Symrise AG、高砂香料工業株式会社、International Flavors &Fragrances Inc.、Givaudan、S H Kelkar and Company、Robertet、BASF SE、LANXESS、Hindustan Mint and Agro、花王株式会社などがあります。地位を強化するため、主要企業はグローバルサプライチェーンの拡大、製造技術のアップグレード、研究開発への投資の増加に注力しています。多くの企業が、地域の嗜好や規制要件に合わせてカスタマイズしたアロマ・ソリューションを開発しています。戦略的な合併、提携、買収は、プレーヤーが事業を拡大し、製品ポートフォリオを多様化するのに役立っています。
よくあるご質問
目次
第1章 調査手法と範囲
第2章 エグゼクティブサマリー
第3章 業界考察
- エコシステム分析
- サプライヤーの情勢
- 利益率
- 各段階における付加価値
- バリューチェーンに影響を与える要因
- ディスラプション
- 業界への影響要因
- 促進要因
- 業界の潜在的リスク&課題
- 市場機会
- 成長可能性分析
- 規制情勢
- 北米
- 欧州
- アジア太平洋地域
- ラテンアメリカ
- 中東・アフリカ
- ポーター分析
- PESTEL分析
- テクノロジーとイノベーションの展望
- 現在の技術動向
- 新興技術
- 価格動向
- 地域別
- 製品別
- 今後の市場動向
- 技術革新の状況
- 現在の技術動向
- 新興技術
- 特許情勢
- 貿易統計(HSコード)(注:貿易統計は主要国についてのみ提供される)
- 主要輸入国
- 主要輸出国
- 持続可能性と環境側面
- 持続可能な慣行
- 廃棄物削減戦略
- 生産におけるエネルギー効率
- 環境にやさしい取り組み
- カーボンフットプリント
第4章 競合情勢
- イントロダクション
- 企業の市場シェア分析
- 地域別
- 北米
- 欧州
- アジア太平洋地域
- ラテンアメリカ
- 中東・アフリカ
- 地域別
- 企業マトリックス分析
- 主要市場企業の競合分析
- 競合ポジショニングマトリックス
- 主な発展
- 合併・買収
- パートナーシップ
- 新製品発表
- 拡張計画
第5章 市場推計・予測:製品別、2021-2034
- 主要動向
- ベンゼノイド
- テルペノイド
- ムスク化合物
- その他
第6章 市場推計・予測:ソース別、2021-2034
- 主要動向
- 天然
- 合成
第7章 市場推計・予測:用途別、2021-2034
- 主要動向
- 飲食品
- ファインフレグランス
- 化粧品・トイレタリー
- 石鹸・洗剤
- 家庭用
- その他
第8章 市場推計・予測:地域別、2021-2034
- 主要動向
- 北米
- 米国
- カナダ
- 欧州
- ドイツ
- 英国
- フランス
- スペイン
- イタリア
- その他欧州地域
- アジア太平洋地域
- 中国
- インド
- 日本
- オーストラリア
- 韓国
- その他アジア太平洋地域
- ラテンアメリカ
- ブラジル
- メキシコ
- アルゼンチン
- その他ラテンアメリカ地域
- 中東・アフリカ
- サウジアラビア
- 南アフリカ
- アラブ首長国連邦
- その他中東・アフリカ地域
第9章 企業プロファイル
- BASF SE
- Givaudan
- Hindustan Mint and Agro
- International Flavors &Fragrances Inc.
- Kao Corporation
- LANXESS
- MANE
- PFW Aroma Chemicals(Kelkar Group)
- Robertet
- S H Kelkar and Company
- Symrise AG
- Takasago International Corporation

