
電子走査アレイの市場機会、成長要因、業界動向分析、および2026年~2035年の予測
Electronically Scanned Arrays Market Opportunity, Growth Drivers, Industry Trend Analysis, and Forecast 2026 - 2035- 発行日
- ページ情報
- 英文 210 Pages
- 納期
- 2~3営業日
- 商品コード
- 2027578
- カスタマイズ可能 お客様のご希望に応じて、既存データの加工や未掲載情報(例:国別セグメント)の追加などの対応が可能です。詳細はお問い合わせください。
- 翻訳ツール提供対象 PDF対応AI翻訳ツールの無料貸し出しサービスのご利用が可能です
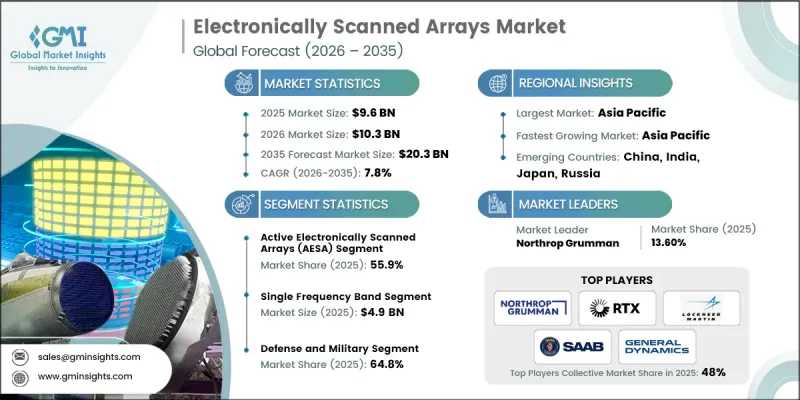
世界の電子走査アレイ(ESA)市場は、2025年に96億米ドルと評価され、CAGR 7.8%で成長し、2035年までに203億米ドルに達すると推定されています。
この拡大は、軍事、航空宇宙、および商業用途における精密探知および多目標追跡への需要の高まりに後押しされています。世界各国の政府は、状況認識と脅威監視を向上させるため、高度な航空機搭載ISRシステムを優先しており、これが戦闘機、無人航空機、海上哨戒機、およびAEW&Cプラットフォームへの導入を促進しています。さらに、AI対応センシングシステム、ネットワーク中心型防衛技術、宇宙ベースのアプリケーションとの統合が市場を後押ししており、民間航空交通管理や宇宙探査も新たな機会をもたらしています。レーダーの近代化への投資拡大と、信頼性の高い高性能センシングシステムへのニーズの高まりが、電子走査アレイ(ESA)産業を牽引し続けています。
| 市場の範囲 | |
|---|---|
| 開始年 | 2025年 |
| 予測期間 | 2026年~2035年 |
| 開始時の市場規模 | 96億米ドル |
| 予測額 | 203億米ドル |
| CAGR | 7.8% |
2025年時点で、アクティブ電子走査アレイ(AESA)セグメントは55.9%のシェアを占めました。これは主に、その高速ビームステアリング、多目標追跡能力、および電子対抗措置に対する高い耐性によるものです。これらのアレイは信頼性が高く、メンテナンスが最小限で済み、優れた性能を発揮するため、現代の防衛システム、航空宇宙用途、監視ネットワークにおいて最適な選択肢となっています。戦闘機、海軍防衛システム、防空用途などでの広範な採用により、AESAは市場での優位性を維持しています。
単一周波数帯セグメントは、その信頼性の高い高出力性能と統合の容易さにより、2025年には49億米ドルに達しました。これは、既存のレーダーシステム、海軍作戦、早期警戒ネットワークで広く利用されています。その堅牢なアーキテクチャと実証済みの信頼性により、地上および海軍レーダーの配備における継続的な採用が後押しされています。
2025年、北米の電子走査アレイ市場は38.2%のシェアを占めました。同地域の成長は、大規模な防衛近代化の取り組みと先進的な航空宇宙技術によって牽引されています。軍用航空システム、ミサイル防衛ネットワーク、および海軍プラットフォームに対する高い需要が、AESAおよびPESA技術の導入を後押ししています。さらに、旧式レーダーシステムの継続的なアップグレード、民間航空および宇宙プラットフォームへの採用、そして主要な防衛請負業者によって支えられた強力な研究開発インフラが、同地域の市場拡大を促進しています。
よくあるご質問
目次
第1章 調査手法と範囲
第2章 エグゼクティブサマリー
第3章 業界考察
- エコシステム分析
- サプライヤーの情勢
- 利益率
- コスト構造
- 各段階における付加価値
- バリューチェーンに影響を与える要因
- ディスラプション
- 業界への影響要因
- 促進要因
- 世界の防衛および国土安全保障支出の増加
- 宇宙、衛星、および新興アプリケーション分野における採用の拡大
- レーダーおよびアンテナ技術の進歩
- 航空機搭載型情報・監視・偵察(ISR)に対する需要の高まり
- 民間航空の拡大と高度な航空交通管理
- 業界の潜在的リスク&課題
- 高い開発コストと複雑なシステム統合要件
- 厳格な規制、輸出管理、および認証要件
- 市場機会
- 宇宙通信および衛星コンステレーションの展開拡大
- 次世代の自律型および無人システムの導入拡大
- 促進要因
- 成長可能性分析
- 規制情勢
- 北米
- 欧州
- アジア太平洋地域
- ラテンアメリカ
- 中東・アフリカ
- ポーターの分析
- PESTEL分析
- 技術およびイノベーションの動向
- 現在の技術動向
- 新興技術
- 価格動向
- 地域別
- 製品別
- 価格戦略
- 新興ビジネスモデル
- コンプライアンス要件
- 特許および知的財産分析
- 地政学的および貿易の動向
第4章 競合情勢
- イントロダクション
- 企業の市場シェア分析
- 地域別
- 北米
- 欧州
- アジア太平洋地域
- ラテンアメリカ
- 中東・アフリカ
- 市場集中度の分析
- 地域別
- 主要企業の競合ベンチマーキング
- 財務実績の比較
- 売上高
- 利益率
- 研究開発
- 製品ポートフォリオの比較
- 製品ラインの幅
- 技術
- イノベーション
- 地域展開の比較
- 世界展開の分析
- サービスネットワークのカバー範囲
- 地域別市場浸透率
- 競合ポジショニングマトリックス
- リーダー
- チャレンジャー
- フォロワー
- ニッチプレイヤー
- 戦略的展望マトリックス
- 財務実績の比較
- 主な発展
- 合併・買収
- 提携および協業
- 技術的進歩
- 拡大および投資戦略
- デジタルトランスフォーメーションの取り組み
- 新興・スタートアップ競合企業の動向
第5章 市場推計・予測:タイプ別、2022-2035
- 能動型電子走査アレイ(AESA)
- 受動型電子走査アレイ(PESA)
第6章 市場推計・予測:アレイ形状別、2022-2035
- 平面アレイ
- リニアアレイ
- 周波数走査アレイ
第7章 市場推計・予測:周波数帯別、2022-2035
- 単一周波数
- Xバンド
- Sバンド
- Lバンド
- Cバンド
- その他
- マルチ周波数
第8章 市場推計・予測:航続距離別、2022-2035
- 短距離(50 km未満)
- 中距離(50~300 km)
- 長距離(300 km超)
第9章 市場推計・予測:プラットフォーム別、2022-2035
- 航空
- 海軍
- 地上
- 宇宙
第10章 市場推計・予測:用途別、2022-2035
- レーダー
- 通信
- 航法
- 電子戦(EW)
- その他
第11章 市場推計・予測:用途別、2022-2035
- 防衛・軍事
- 航空監視・早期警戒
- 射撃管制・ミサイル誘導システム
- 電子戦(EW)および妨害システム
- 海軍レーダーおよび海上監視
- 地上配備型防空システム
- その他
- 民生・商業
- 航空交通管制・管理
- 気象観測・予報
- 衛星通信
- 航法
- その他
第12章 市場推計・予測:地域別、2022-2035
- 北米
- 米国
- カナダ
- 欧州
- ドイツ
- 英国
- フランス
- スペイン
- イタリア
- ロシア
- アジア太平洋地域
- 中国
- インド
- 日本
- オーストラリア
- 韓国
- ラテンアメリカ
- ブラジル
- メキシコ
- アルゼンチン
- 中東・アフリカ
- 南アフリカ
- サウジアラビア
- アラブ首長国連邦
第13章 企業プロファイル
- 世界の主要企業
- Northrop Grumman
- RTX Corporation
- Lockheed Martin Corporation
- Saab AB
- General Dynamics Corporation
- 地域別主要企業
- 北米
- BAE Systems
- General Dynamics Corporation
- L3Harris Technologies, Inc.
- Lockheed Martin Corporation
- Northrop Grumman
- RTX Corporation
- Teledyne Technologies Incorporated
- Viasat, Inc.
- アジア太平洋地域
- Bharat Electronics Limited
- Hanwha Systems Co., Ltd.
- LIG Nex1 Co., Ltd.
- Mitsubishi Electric Corporation
- 欧州
- Hensoldt AG
- Indra Sistemas, S.A.
- Leonardo S.p.A.
- Saab AB
- Thales Group
- Middle East &Africa
- Aselsan A.S.
- Elbit Systems Ltd.
- Israel Aerospace Industries Ltd.
- 北米
- ニッチプレイヤー/ディスラプター
- Ravpower
- 発行日
- 発行
- Global Market Insights Inc.
- ページ情報
- 英文 210 Pages
- 納期
- 2~3営業日