
|
市場調査レポート
商品コード
1833669
電力オプティマイザの市場機会、成長促進要因、産業動向分析、2025年~2034年予測Power Optimizer Market Opportunity, Growth Drivers, Industry Trend Analysis, and Forecast 2025 - 2034 |
||||||
カスタマイズ可能
|
|||||||
| 電力オプティマイザの市場機会、成長促進要因、産業動向分析、2025年~2034年予測 |
|
出版日: 2025年09月05日
発行: Global Market Insights Inc.
ページ情報: 英文 121 Pages
納期: 2~3営業日
|

概要
電力オプティマイザの世界市場規模は、2024年に79億米ドルとなり、CAGR 12.6%で成長し、2034年には258億米ドルに達すると予測されています。
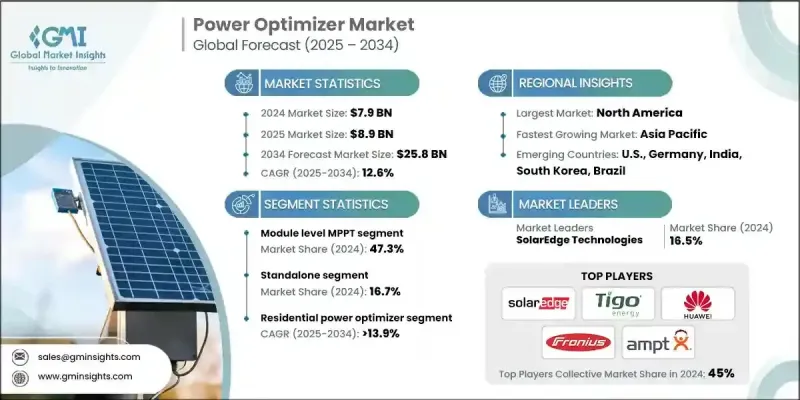
より高いエネルギー出力と安全性の高い太陽光発電システムに対する需要が住宅・商業の両分野で伸び続けていることから、同産業は顕著な勢いを見せています。電力オプティマイザは現在、最新の太陽光発電インフラの中心的存在であり、リアルタイム監視とシステム診断を可能にすることで、歩留まりの向上と運用コストの削減に貢献しています。エネルギー貯蔵システムとスマートグリッドプラットフォームの統合が進むにつれ、これらの技術がより大きなエネルギー制御、安定したグリッド相互作用、双方向の電力通信をサポートするため、この成長が強化されています。IoT、人工知能、クラウドベースの分析における革新は、電力オプティマイザの機能を再構築し、よりスマートな予知保全とシステム効率の向上を実現しています。メーカーはまた、持続可能性の目標に沿うため、低フットプリント設計やリサイクル可能な部品に投資しています。世界中で太陽光発電の導入を奨励する規制の枠組みは、特に分散型エネルギー発電を目的としたインセンティブによって、市場の拡大に拍車をかけています。さらに、ブロックチェーンとソーラーシステムの融合は、透明で安全なエネルギー取引の機会を開き、分散型の再生可能エネルギー・エコシステムを強化し、スマート・エネルギー・ソリューションの世界的な受け入れを促進しています。
| 市場範囲 | |
|---|---|
| 開始年 | 2024 |
| 予測年 | 2025-2034 |
| 市場規模 | 79億米ドル |
| 予測金額 | 258億米ドル |
| CAGR | 12.6% |
モジュールレベルのMPPT分野は、2024年に47.3%のシェアを占め、2034年までCAGR 3.1%で成長すると予想されます。この技術は、特に日陰や様々な傾斜角度、不規則なパネル構成の影響を受ける設置において、パネル単位でのエネルギー生産量を向上させるために不可欠となっています。新興経済諸国や先進経済諸国において屋上太陽光発電の導入が加速するにつれ、よりきめ細かな電力追跡やパネルレベルの制御強化が求められ、モジュールレベルのMPPTソリューションの需要が高まっています。米国、インド、欧州を含む各地域で、金融優遇措置や有利な政府政策が市場浸透を強めており、電子部品のコスト削減により、この技術はますます手頃な価格になっています。
オングリッド分野は2024年に83.3%のシェアを占め、2034年までのCAGRは11.9%と予想されます。電力会社のインフラに太陽光発電を統合するための強力な政策支援、特にネットメータリング・プログラムやスマートグリッドへの取り組みにより、オングリッド・システムが優位を保っています。こうした政策は、住宅や商業施設の屋上への太陽光発電の設置を促進するだけでなく、さまざまな生産レベルにわたってエネルギーの安定性を維持するために、高性能の電力最適化装置が必要となります。住宅、オフィスビル、産業用構造物への屋上太陽光発電の設置は一般的になりつつあり、このような用途では、部分的な日陰や複雑な屋根形状によるエネルギー損失を最小限に抑えるために、オプティマイザが極めて重要です。
米国電力オプティマイザ市場は83.8%のシェアを占め、2024年には35億米ドルを生み出します。米国市場の成長は、政策イニシアティブ、消費者の意識、住宅、商業施設、公共施設規模での太陽光発電導入の堅調な増加の組み合わせによって牽引され続けています。金融優遇措置や税額控除によって太陽光発電の費用対効果が高まり、設置率が上昇し、性能とシステムの信頼性を高める最適化技術への需要が高まっています。デジタルグリッドシステムが進歩し、再生可能エネルギーの独立性が重視される中、電力最適化装置は、シームレスな統合と効率的な電力供給を確保する上で重要な役割を果たしています。
世界の電力オプティマイザ産業を積極的に形成している主要企業には、Tigo Energy、Fronius International、Huawei Technologies、HIITIO、Ferroamp、Altenergy Power System、Infineon Technologies、SolarEdge Technologies、Suzhou Convert Semiconductor、Sun Sine Solution、Ampt、PCE Process Control Electronics、Alencon Systems、SUNGROWなどがあります。主要企業は、製品イノベーションと戦略的パートナーシップを活用し、市場での存在感を高めています。メーカー各社は、AI、IoT、クラウドベースのアナリティクスをシステムに統合し、よりスマートなモニタリング、予知保全、エネルギー収率の向上を提供することに注力しています。モジュール式でスケーラブルな設計を重視することで、住宅、商業施設、公共施設規模での導入のためのカスタマイズが可能になります。ソーラーパネル・メーカーや設置業者とのコラボレーションにより、流通網が強化され、市場アクセスが拡大しています。
目次
第1章 調査手法と範囲
第2章 エグゼクティブサマリー
第3章 業界考察
- エコシステム分析
- 原材料・部品サプライヤー
- テクノロジーとデザイン
- 製造業
- 流通・物流
- インストールと統合
- アフターサービス
- 規制情勢
- 業界への影響要因
- 促進要因
- 業界の潜在的リスク&課題
- 成長可能性分析
- ポーター分析
- PESTEL分析
- 新たな機会と動向
- デジタル化とIoTの統合
- 新興市場への浸透
- 投資分析と将来展望
第4章 競合情勢
- イントロダクション
- 企業の市場シェア分析:地域別
- 北米
- 欧州
- アジア太平洋地域
- 中東・アフリカ
- ラテンアメリカ
- 戦略的ダッシュボード
- 戦略的取り組み
- 主要なパートナーシップとコラボレーション
- 主要なM&A活動
- 製品の革新と発売
- 市場拡大戦略
- 競合ベンチマーキング
- イノベーションと持続可能性の情勢
第5章 市場規模・予測:最終用途別、2021-2034
- 主要動向
- モジュールレベルのMPPT
- 高度な電力線通信
- 監視コンポーネント
- 安全シャットダウンコンポーネント
- その他
第6章 市場規模・予測:接続性別、2021-2034
- 主要動向
- スタンドアロン
- グリッド上
第7章 市場規模・予測:用途別、2021-2034
- 主要動向
- 住宅用
- 商業および工業
- ユーティリティ
第8章 市場規模・予測:地域別、2021-2034
- 主要動向
- 北米
- 米国
- カナダ
- 欧州
- ドイツ
- イタリア
- オランダ
- 英国
- フランス
- アジア太平洋地域
- 中国
- オーストラリア
- 日本
- 韓国
- インド
- 中東・アフリカ
- サウジアラビア
- アラブ首長国連邦
- 南アフリカ
- ラテンアメリカ
- ブラジル
- チリ
- メキシコ
第9章 企業プロファイル
- Alencon Systems
- Altenergy Power System
- Ampt
- Ferroamp
- Fronius International
- HIITIO
- Huawei Technologies
- Infineon Technologies
- PCE Process Control Electronic
- SolarEdge Technologies
- SUNGROW
- Sun Sine Solution
- Suzhou Convert Semiconductor
- Tigo Energy

