
|
市場調査レポート
商品コード
1721528
コンデンサバンク市場の市場機会、成長促進要因、産業動向分析と2025年~2034年予測Capacitor Bank Market Opportunity, Growth Drivers, Industry Trend Analysis, and Forecast 2025 - 2034 |
||||||
カスタマイズ可能
|
|||||||
| コンデンサバンク市場の市場機会、成長促進要因、産業動向分析と2025年~2034年予測 |
|
出版日: 2025年04月08日
発行: Global Market Insights Inc.
ページ情報: 英文 150 Pages
納期: 2~3営業日
|

全表示
- 概要
- 目次
コンデンサバンクの世界市場規模は、2024年に31億米ドルとなり、CAGR 4%で成長し、2034年には46億米ドルに達すると予測されています。
この成長は、先進国、新興経済諸国を問わず、エネルギー集約型経済諸国がエネルギー効率と送電網の信頼性を優先し続けることによるものです。世界の電力需要がかつてない勢いで増加するなか、電圧レベルを安定させ、力率を改善し、エネルギー損失を削減するために不可欠な部品として、産業界と政府はコンデンサ・バンクに注目しています。電力インフラの近代化、特に都市化が急速に進む地域では、こうしたシステムの導入が盛んになっています。市場各社は、次世代送電網の要件に適合する小型でスマートなデジタル対応コンデンサバンクを導入することで、この需要に対応しています。風力や太陽光などの再生可能エネルギー源のグリッドへの統合が進むにつれ、無効電力サポートの必要性も高まっており、コンデンサ・バンクはエネルギー転換の目標を実現する重要な要素となっています。持続可能性の目標に沿って、政策立案者は最大効率で動作する低損失電力システムを推進しています。こうした動向は、長期的な送電網のアップグレードと回復力強化プロジェクトに重点を置く官民パートナーシップによって、世界中でさらに後押しされています。
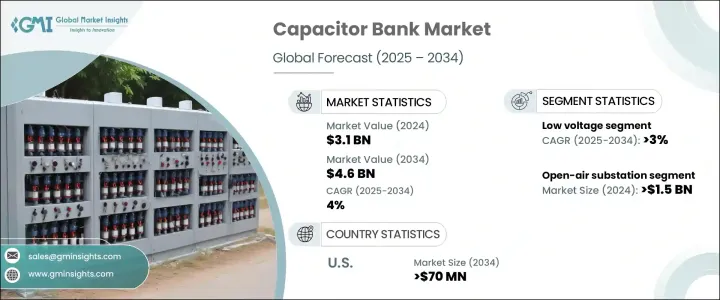
電圧別では、低電圧分野は2034年までCAGR 3%で安定的に成長します。この成長の原動力となっているのは、インフラが限られた未開発地域におけるエネルギー需要の高まりと、新興経済諸国における継続的なネットワーク改善です。住宅、商業、軽工業のユーザーがより良い電力品質とシステムの安定性を求める中、低電圧コンデンサ・バンクの人気が高まっています。そのコンパクトな設計、統合の容易さ、コスト効率は、インフラが急速に拡張している地域に理想的です。これらのユニットは、エネルギー節約と機器の寿命を確保しながら、負荷需要の変化に対応するために必要な柔軟性を提供します。
| 市場範囲 | |
|---|---|
| 開始年 | 2024 |
| 予測年 | 2025-2034 |
| 開始金額 | 31億米ドル |
| 予測金額 | 46億米ドル |
| CAGR | 4% |
構成別では、開放型変電所セグメントは2024年に15億米ドルを生み出しました。このセグメントの成長を支えているのは、大規模送電プロジェクトとスマートグリッド技術への持続的投資です。公益事業者は、特に高負荷シナリオにおいて、拡張配電網全体の電圧を安定させる能力から、これらのシステムを好んでいます。製造業、再生可能エネルギー、通信などの業界では、中断のない電力供給と拡張可能なインフラ・ソリューションを確保するため、こうした構成への依存度が高まっています。
米国のコンデンサバンク市場は、2024年に5億5,780万米ドルを生み出し、2034年には7億米ドルに達すると予測されています。電気自動車の普及とデータセンターの大規模な拡張が、無効電力補償の強化の必要性を煽っています。先進的なグリッド構造と低排出システムに対する強力な規制の後押しにより、米国は高性能コンデンサ・バンクの導入で引き続きリードしています。
世界コンデンサバンク市場の主要プレーヤーには、ZEZ SILKO、CIRCUTOR、SHARDA Electronics、LAXMI ELECTRONICS、ABB、Schneider Electric、General Electric、Siemens、LIFASA、Hitachi Energy、ARTECHE、Powerside、Aener Energia、Eaton、Enerlux Powerなどがあります。各社は、スマートで効率的、遠隔監視が可能なコンデンサ・バンクを発売するため、研究開発に多額の投資を行っています。電力会社や政府機関との戦略的パートナーシップは、これらの企業が地域に特化したソリューションを提供し、的を絞った買収を通じて新たな市場機会を開拓するのに役立っています。
目次
第1章 調査手法と範囲
第2章 エグゼクティブサマリー
第3章 業界考察
- エコシステム分析
- 規制情勢
- 業界への影響要因
- 促進要因
- 業界の潜在的リスク&課題
- 成長可能性分析
- ポーターの分析
- 供給企業の交渉力
- 買い手の交渉力
- 新規参入業者の脅威
- 代替品の脅威
- PESTEL分析
第4章 競合情勢
- イントロダクション
- 戦略的展望
- イノベーションと持続可能性の情勢
第5章 市場規模・予測:電圧別、2021-2034
- 主要動向
- 低電圧[<10 kV]
- 中電圧[10 kV-69 kV]
- 高[>69 kV]
第6章 市場規模・予測:タイプ別、2021-2034
- 主要動向
- 屋外変電所
- 金属製密閉型変電所
- ポールマウント
- その他
第7章 市場規模・予測:用途別、2021-2034
- 主要動向
- 力率改善
- 高調波フィルタ
- 電圧調整
- 再生可能エネルギーの統合
- 産業用途
- データセンター
- その他
第8章 市場規模・予測:地域別、2021-2034
- 主要動向
- 北米
- 米国
- カナダ
- メキシコ
- 欧州
- ドイツ
- フランス
- スペイン
- イタリア
- 英国
- オランダ
- ロシア
- スウェーデン
- アジア太平洋地域
- 中国
- インド
- 日本
- 韓国
- インドネシア
- ニュージーランド
- マレーシア
- タイ
- シンガポール
- オーストラリア
- 中東・アフリカ
- サウジアラビア
- アラブ首長国連邦
- カタール
- オマーン
- 南アフリカ
- ラテンアメリカ
- ブラジル
- チリ
- アルゼンチン
第9章 企業プロファイル
- ABB
- Aener Energia
- ARTECHE
- LAXMI ELECTRONICS
- CIRCUTOR
- Eaton
- Enerlux Power
- General Electric
- Hitachi Energy
- SHARDA Electronics
- Powerside
- Schneider Electric
- LIFASA
- Siemens
- ZEZ SILKO
The Global Capacitor Bank Market was valued at USD 3.1 billion in 2024 and is estimated to grow at a CAGR of 4% to reach USD 4.6 billion by 2034. This growth comes as energy-intensive economies, both developed and developing, continue to prioritize energy efficiency and grid reliability. With the global demand for electricity rising at an unprecedented rate, industries and governments are turning to capacitor banks as essential components to stabilize voltage levels, improve power factor, and reduce energy losses. The modernization of power infrastructure, especially in fast-urbanizing regions, has created a thriving landscape for the deployment of these systems. Market players are responding to this demand by introducing compact, smart, and digitally enabled capacitor banks that align with next-gen grid requirements. The rising integration of renewable energy sources like wind and solar into the grid is also increasing the need for reactive power support, making capacitor banks a key enabler for energy transition goals. In line with sustainability objectives, policymakers are pushing for low-loss power systems that operate with maximum efficiency. These trends are further backed by public-private partnerships focused on long-term grid upgrades and resilience enhancement projects worldwide.
By voltage, the low voltage segment is set to grow steadily at a CAGR of 3% through 2034. This growth is being driven by mounting energy demands in underdeveloped regions with limited infrastructure and continuous network improvements across developed economies. As residential, commercial, and light industrial users seek better power quality and system stability, low-voltage capacitor banks are gaining traction. Their compact design, ease of integration, and cost efficiency make them ideal for areas undergoing rapid infrastructure expansion. These units offer the flexibility needed to accommodate shifting load demands while ensuring energy savings and equipment longevity.
| Market Scope | |
|---|---|
| Start Year | 2024 |
| Forecast Year | 2025-2034 |
| Start Value | $3.1 Billion |
| Forecast Value | $4.6 Billion |
| CAGR | 4% |
In terms of configuration, the open-air substation segment generated USD 1.5 billion in 2024. The segment's growth is supported by sustained investments in large-scale power transmission projects and smart grid technologies. Utilities prefer these systems due to their ability to stabilize voltage across extended distribution networks, particularly in high-load scenarios. Industries such as manufacturing, renewables, and telecommunications are increasingly relying on these configurations to ensure uninterrupted power delivery and scalable infrastructure solutions.
The United States Capacitor Bank Market generated USD 557.8 million in 2024 and is projected to reach USD 700 million by 2034. The growing adoption of electric vehicles and large-scale expansion of data centers are fueling the need for enhanced reactive power compensation. With an advanced grid structure and strong regulatory push for low-emission systems, the U.S. continues to lead in deploying high-performance capacitor banks.
Key players in the Global Capacitor Bank Market include ZEZ SILKO, CIRCUTOR, SHARDA Electronics, LAXMI ELECTRONICS, ABB, Schneider Electric, General Electric, Siemens, LIFASA, Hitachi Energy, ARTECHE, Powerside, Aener Energia, Eaton, and Enerlux Power. Companies are investing heavily in R&D to launch smart, efficient, and remote-monitoring enabled capacitor banks. Strategic partnerships with utilities and government entities are helping these firms offer region-specific solutions and tap into new market opportunities through targeted acquisitions.
Table of Contents
Chapter 1 Methodology & Scope
- 1.1 Research design
- 1.2 Market estimates & forecast parameters
- 1.3 Forecast calculation
- 1.4 Data sources
- 1.4.1 Primary
- 1.4.2 Secondary
- 1.4.2.1 Paid
- 1.4.2.2 Public
- 1.5 Market definitions
Chapter 2 Executive Summary
- 2.1 Industry synopsis, 2021 - 2034
Chapter 3 Industry Insights
- 3.1 Industry ecosystem analysis
- 3.2 Regulatory landscape
- 3.3 Industry impact forces
- 3.3.1 Growth drivers
- 3.3.2 Industry pitfalls & challenges
- 3.4 Growth potential analysis
- 3.5 Porter's analysis
- 3.5.1 Bargaining power of suppliers
- 3.5.2 Bargaining power of buyers
- 3.5.3 Threat of new entrants
- 3.5.4 Threat of substitutes
- 3.6 PESTEL analysis
Chapter 4 Competitive Landscape, 2025
- 4.1 Introduction
- 4.2 Strategic outlook
- 4.3 Innovation & sustainability landscape
Chapter 5 Market Size and Forecast, By Voltage, 2021 - 2034 (USD Million & '000 Units)
- 5.1 Key trends
- 5.2 Low [<10 kV]
- 5.3 Medium [10 kV - 69 kV]
- 5.4 High [>69 kV]
Chapter 6 Market Size and Forecast, By Type, 2021 - 2034 (USD Million & '000 Units)
- 6.1 Key trends
- 6.2 Open air substation
- 6.3 Metal enclosed substation
- 6.4 Pole mounted
- 6.5 Others
Chapter 7 Market Size and Forecast, By Application, 2021 - 2034 (USD Million & '000 Units)
- 7.1 Key trends
- 7.2 Power factor correction
- 7.3 Harmonic filter
- 7.4 Voltage regulation
- 7.5 Renewable integration
- 7.6 Industrial application
- 7.7 Data centers
- 7.8 Others
Chapter 8 Market Size and Forecast, By Region, 2021 - 2034 (USD Million & '000 Units)
- 8.1 Key trends
- 8.2 North America
- 8.2.1 U.S.
- 8.2.2 Canada
- 8.2.3 Mexico
- 8.3 Europe
- 8.3.1 Germany
- 8.3.2 France
- 8.3.3 Spain
- 8.3.4 Italy
- 8.3.5 UK
- 8.3.6 Netherlands
- 8.3.7 Russia
- 8.3.8 Sweden
- 8.4 Asia Pacific
- 8.4.1 China
- 8.4.2 India
- 8.4.3 Japan
- 8.4.4 South Korea
- 8.4.5 Indonesia
- 8.4.6 New Zealand
- 8.4.7 Malaysia
- 8.4.8 Thailand
- 8.4.9 Singapore
- 8.4.10 Australia
- 8.5 Middle East & Africa
- 8.5.1 Saudi Arabia
- 8.5.2 UAE
- 8.5.3 Qatar
- 8.5.4 Oman
- 8.5.5 South Africa
- 8.6 Latin America
- 8.6.1 Brazil
- 8.6.2 Chile
- 8.6.3 Argentina
Chapter 9 Company Profiles
- 9.1 ABB
- 9.2 Aener Energia
- 9.3 ARTECHE
- 9.4 LAXMI ELECTRONICS
- 9.5 CIRCUTOR
- 9.6 Eaton
- 9.7 Enerlux Power
- 9.8 General Electric
- 9.9 Hitachi Energy
- 9.10 SHARDA Electronics
- 9.11 Powerside
- 9.12 Schneider Electric
- 9.13 LIFASA
- 9.14 Siemens
- 9.15 ZEZ SILKO

