デフォルト表紙
市場調査レポート
商品コード
1535986

バイオバニリンの市場規模:用途別、予測、2024年~2032年

Bio Vanillin Market - Size by Application (Food and Beverages {Ice Cream, Chocolate, Confectioneries & Baked Goods, Others} Fragrances, Pharmaceuticals) & Forecast, 2024 - 2032


出版日
ページ情報
英文 200 Pages
納期
2~3営業日
カスタマイズ可能
価格
価格表記: USDを日本円(税抜)に換算
本日の銀行送金レート: 1USD=144.06円
バイオバニリンの市場規模:用途別、予測、2024年~2032年
出版日: 2024年06月18日
発行: Global Market Insights Inc.
ページ情報: 英文 200 Pages
納期: 2~3営業日
GIIご利用のメリット
  • 全表示
  • 概要
  • 目次
概要

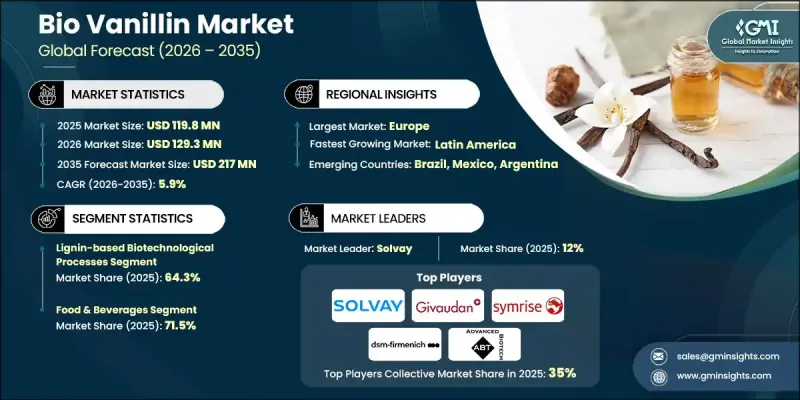
バイオバニリンの市場規模は、バイオテクノロジーの発売と進歩の増加に牽引され、2024年から2032年の間にCAGR 7.4%を記録すると予想されます。

操作された微生物の使用を含む急速な進歩は、生産プロセスの拡張性と環境への優しさを強化するために、再生可能な資源をバイオバニリンに変換するのに役立っています。天然で持続可能な原料を求める消費者の需要が高まる中、企業はエンドユーザーのニーズに応えるため、こうした革新的な技術を取り入れています。例えば、2022年9月、ソルベイは3つの新しいバイオバニリンフレーバーを発売することで、Rhovanil(R)Natural CWレンジを拡大した:Rhovanil(R)NaturalのDelica、Alta、Sublimaは飲食品分野で風味を向上させる。

業界は用途と地域によって区分されます。

用途別では、天然由来で持続可能な生産が可能なことから、医薬品分野のバイオバニリン市場シェアが2024-2032年の間に顕著な収益を上げると予想されています。バイオバニリンは、風味のマスキング、安定性の向上、合成添加物の天然代替物としての潜在的な利点から、製剤に広く組み込まれています。また、研究者はバイオバニリンの特性を評価し、様々な医薬品における有効性と安全性を判断しています。特定の医薬品の不快な味をマスキングし、患者に食べやすくするために、特にシロップ、錠剤、咀嚼可能な形態のような経口薬に使用されることが増加し、セグメントの成長を後押しします。

北米のバイオバニリン産業規模は、天然製品に対する規制当局の支援の高まりと、健康と安全への関心の高まりによって、2032年まで顕著な成長率を記録する可能性が高いです。規制支援は、食品、飲食品、医薬品を含む様々な分野での製品採用を促進しています。続いて、健康と安全性に関する意識の高まりが、天然でより安全な原料への需要を促進し、バイオバニリンの使用をさらに後押ししています。バイオテクノロジーの進歩は、バイオバニリンが様々な用途において実行可能で魅力的な選択肢であり続けることを確実にするため、この地域での生産方法を強化することにもなります。

目次

第1章 調査手法と調査範囲

第2章 エグゼクティブサマリー

第3章 業界洞察

  • エコシステム分析
    • 主要メーカー
    • 流通業者
    • 業界全体の利益率
  • 業界への影響要因
    • 促進要因
    • 市場の課題
    • 市場機会
      • 新たな機会
      • 成長可能性分析
  • 原材料情勢
    • 製造動向
    • 技術の進化
  • 持続可能な製造
      • グリーン・プラクティス
      • 脱炭素化
    • 原材料の持続可能性
  • 価格動向(米ドル/トン)、2021~2032年
  • 規制と市場への影響
  • ポーター分析
  • PESTEL分析

第4章 競合情勢

  • イントロダクション
  • 企業マトリックス分析
  • 企業シェア分析
    • 地域別企業シェア分析
      • 北米
      • 欧州
      • アジア太平洋
      • ラテンアメリカ
      • 中東アフリカ
  • 競合のポジショニング・マトリックス
  • 戦略ダッシュボード

第5章 市場規模・予測:用途別、2021年~2032年

  • 主要動向
  • 飲食品
    • アイスクリーム
    • チョコレート
    • 菓子類・焼き菓子
    • その他
  • フレグランス
  • 医薬品

第6章 市場推計・予測:地域別、2021年~2032年

  • 北米
    • 米国
    • カナダ
  • 欧州
    • ドイツ
    • 英国
    • フランス
    • イタリア
    • スペイン
    • ロシア
    • その他欧州
  • アジア太平洋
    • 中国
    • インド
    • 日本
    • 韓国
    • オーストラリア
    • マレーシア
    • インドネシア
    • その他アジア太平洋地域
  • ラテンアメリカ
    • ブラジル
    • メキシコ
    • アルゼンチン
    • その他ラテンアメリカ
  • 中東・アフリカ
    • サウジアラビア
    • アラブ首長国連邦
    • 南アフリカ
    • その他の中東・アフリカ

第7章 企業プロファイル

  • Evolva
  • Solvay
  • Advanced Biotech
  • Alfrebro, LLC
  • De Monchy Aromatics
  • Ennolys
  • Comax Flavors
  • Omega Ingredients Ltd
  • Beijing LYS Chemicals Co., Ltd
  • Aurochemicals
目次
Product Code: 679

Bio Vanillin Market size is expected to record 7.4% CAGR between 2024 and 2032, driven by increasing launches and advancements in biotechnology.

Rapid advancements, including the usage of engineered microorganisms is helping to convert renewable resources into bio vanillin for enhancing the scalability and environmental friendliness of the production process. With growing consumer demand for natural and sustainable ingredients, companies are embracing these innovative techniques to meet the end-user needs. For instance, in September 2022, Solvay expanded its Rhovanil(R) Natural CW range by launching three new bio vanillin flavors: Rhovanil(R) Natural Delica, Alta, and Sublima to enhance flavor profiles in the food and beverage sectors.

The industry is segmented based on application and region.

In terms of application, the bio vanillin market share from the pharmaceuticals segment is slated to generate notable revenue during 2024-2032 due to its natural origin and sustainable production. bio vanillin is widely integrated into formulations for its potential benefits in flavor masking, stability enhancement, and as a natural alternative to synthetic additives. Researchers are also evaluating the properties of bio vanillin to determine its effectiveness and safety in different pharmaceutical contexts. Rising usage to mask the unpleasant taste of certain drugs for making them more palatable for patients, especially in oral medications like syrups, tablets, and chew able forms will boost the segment growth.

North America bio vanillin industry size is likely to record a notable growth rate through 2032 driven by escalating regulatory support for natural products and the increasing health and safety concerns. Regulatory support is facilitating the product adoption across various sectors, including food, beverages, and pharmaceuticals. Subsequently, rising awareness about health and safety is driving the demand for natural and safer ingredients, further boosting the use of bio vanillin. The ongoing advancements in biotechnology will also enhance the production methods in the region for ensuring that bio vanillin remains a viable and attractive option for various applications.

Table of Contents

Chapter 1 Methodology & Scope

  • 1.1 Market scope & definitions
  • 1.2 Base Size & calculations
  • 1.3 Data collection
  • 1.4 Forecast parameters
  • 1.5 Data validation
  • 1.6 Data sources
    • 1.6.1 Primary
    • 1.6.2 Data mining sources
      • 1.6.2.1 Paid sources
      • 1.6.2.2 Public sources

Chapter 2 Executive Summary

  • 2.1 Industry 360° synopsis

Chapter 3 Industry Insights

  • 3.1 Industry ecosystem analysis
    • 3.1.1 Key manufacturers
    • 3.1.2 Distributors
    • 3.1.3 Profit margins across the industry
  • 3.2 Industry impact forces
    • 3.2.1 Growth drivers
    • 3.2.2 Market challenges
    • 3.2.3 Market opportunity
      • 3.2.3.1 New opportunities
      • 3.2.3.2 Growth potential analysis
  • 3.3 Raw material landscape
    • 3.3.1 Manufacturing trends
    • 3.3.2 Technology evolution
  • 3.4 Sustainable manufacturing
      • 3.4.1.1 Green practices
      • 3.4.1.2 Decarbonization
    • 3.4.2 Sustainability in raw materials
  • 3.5 Pricing trends (USD/Ton), 2021 to 2032
    • 3.5.1 North America
    • 3.5.2 Europe
    • 3.5.3 Asia Pacific
    • 3.5.4 Latin America
    • 3.5.5 Middle East & Africa
  • 3.6 Regulations & market impact
  • 3.7 Porter's analysis
  • 3.8 PESTEL analysis

Chapter 4 Competitive Landscape, 2023

  • 4.1 Introduction
  • 4.2 Company matrix analysis
  • 4.3 Company market share analysis
    • 4.3.1 Company market share analysis by region
      • 4.3.1.1 North America
      • 4.3.1.2 Europe
      • 4.3.1.3 Asia Pacific
      • 4.3.1.4 Latin America
      • 4.3.1.5 Middle East Africa
  • 4.4 Competitive positioning matrix
  • 4.5 Strategic dashboard

Chapter 5 Market Size and Forecast, By Application, 2021-2032 (USD Million, Kilo Tons)

  • 5.1 Key trends
  • 5.2 Food and Beverages
    • 5.2.1 Ice cream
    • 5.2.2 Chocolate
    • 5.2.3 Confectioneries and Baked goods
    • 5.2.4 Others
  • 5.3 Fragrances
  • 5.4 Pharmaceuticals

Chapter 6 Market Estimates and Forecast, By Region, 2021 - 2032 (Kilo Tons) (USD Million)

  • 6.1 North America
    • 6.1.1 U.S.
    • 6.1.2 Canada
  • 6.2 Europe
    • 6.2.1 Germany
    • 6.2.2 UK
    • 6.2.3 France
    • 6.2.4 Italy
    • 6.2.5 Spain
    • 6.2.6 Russia
    • 6.2.7 Rest of Europe
  • 6.3 Asia Pacific
    • 6.3.1 China
    • 6.3.2 India
    • 6.3.3 Japan
    • 6.3.4 South Korea
    • 6.3.5 Australia
    • 6.3.6 Malaysia
    • 6.3.7 Indonesia
    • 6.3.8 Rest of Asia Pacific
  • 6.4 Latin America
    • 6.4.1 Brazil
    • 6.4.2 Mexico
    • 6.4.3 Argentina
    • 6.4.4 Rest of Latin America
  • 6.5 MEA
    • 6.5.1 Saudi Arabia
    • 6.5.2 UAE
    • 6.5.3 South Africa
    • 6.5.4 Rest of MEA

Chapter 7 Company Profiles

  • 7.1 Evolva
  • 7.2 Solvay
  • 7.3 Advanced Biotech
  • 7.4 Alfrebro, LLC
  • 7.5 De Monchy Aromatics
  • 7.6 Ennolys
  • 7.7 Comax Flavors
  • 7.8 Omega Ingredients Ltd
  • 7.9 Beijing LYS Chemicals Co., Ltd
  • 7.10 Aurochemicals