
|
市場調査レポート
商品コード
1982368
ポリ塩化アルミニウムの市場機会、成長要因、業界動向分析、および2026年~2035年の予測Poly Aluminum Chloride Market Opportunity, Growth Drivers, Industry Trend Analysis, and Forecast 2026 - 2035 |
||||||
カスタマイズ可能
|
|||||||
| ポリ塩化アルミニウムの市場機会、成長要因、業界動向分析、および2026年~2035年の予測 |
|
出版日: 2026年02月20日
発行: Global Market Insights Inc.
ページ情報: 英文 210 Pages
納期: 2~3営業日
|

概要
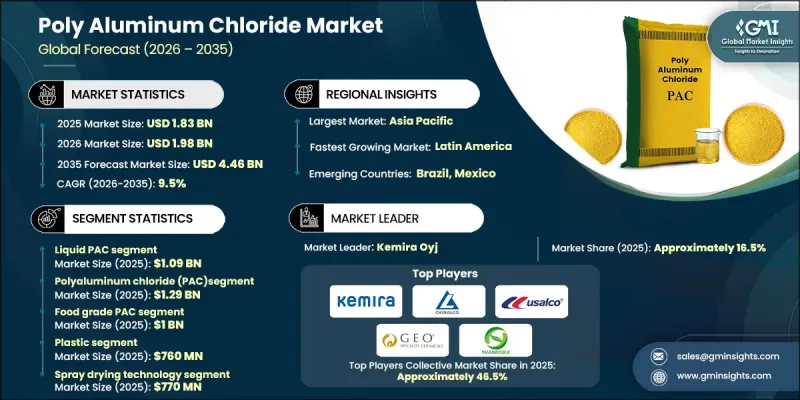
世界のポリ塩化アルミニウム市場は、2025年に18億3,000万米ドルと評価され、CAGR 9.5%で成長し、2035年までに44億6,000万米ドルに達すると予測されています。
ポリ塩化アルミニウム産業は、自治体および産業用水処理用途における需要の高まりを背景に、力強い拡大を遂げています。新興国における急速な都市化と大規模なインフラ開発により、飲料水および廃水処理施設への公的・民間投資が大幅に増加しています。この動向により、濁度、浮遊粒子、その他の汚染物質を除去する高い効率性を有するポリ塩化アルミニウムの消費量が増加しています。水質規制の強化や排出基準の厳格化により、高度な凝集剤への移行がさらに加速しています。繊維、パルプ・製紙、化学、食品加工の各セクターにおける産業活動の拡大に伴い、排出前に効果的な処理を必要とする大量の廃水が発生しています。従来の凝集剤と比較して、ポリ塩化アルミニウムは凝集が速く、発生する汚泥量も少ないため、運用効率の向上と処分コストの削減につながります。したがって、持続的な工業化と継続的な規制の施行は、世界的にポリ塩化アルミニウムに対する着実かつ長期的な需要の伸びにつながっています。
| 市場範囲 | |
|---|---|
| 開始年 | 2025年 |
| 予測期間 | 2026年~2035年 |
| 開始時の市場規模 | 18億3,000万米ドル |
| 予測額 | 44億6,000万米ドル |
| CAGR | 9.5% |
液体PACセグメントは2025年に10億9,000万米ドルを占め、2026年から2035年にかけてCAGR 9.2%で成長すると予想されています。さまざまな製品形態への需要は、用途に応じた取り扱い、保管、および投与要件と密接に関連しています。液体ポリ塩化アルミニウムは、ポンプ送りが容易で、安定した投与能力と迅速な反応性能を備えているため、大規模な自治体や産業用処理施設においてますます好まれるようになっています。一方、粉末、顆粒、フレーク状の形態は、長期保存性、輸送の簡素化、および柔軟な適用が重要な考慮事項となる分散型または小規模な処理施設で支持を集めています。このような製品形態の多様化は、標準化されたソリューションへの依存ではなく、運用上の適応性を重視する業界全体の大きな変化を反映しています。
ポリ塩化アルミニウム(PAC)セグメントの市場規模は2025年に12億9,000万米ドルと評価され、2035年までCAGR 9.2%で成長すると推定されています。各種PACグレードにわたる市場の発展は、処理効率や水質化学的要件に基づく製品差別化の進展を浮き彫りにしています。従来のPACは、自治体および産業用途においてコストパフォーマンスのバランスが取れていることから、引き続き高い採用率を維持しています。同時に、安定性と凝集効率の向上が求められるより複雑な廃水組成に対しては、ポリ塩化アルミニウム硫酸塩や複合PAC製剤などの改良型製品が採用されつつあります。この進化は、画一的な処理アプローチではなく、個々のニーズに合わせた化学処理ソリューションへの移行を浮き彫りにしています。
北米のポリ塩化アルミニウム市場は、2025年に4億6,000万米ドルの規模に達しました。地域的な拡大は、老朽化した水道インフラへの投資増加や、飲料水および排水に関する規制枠組みの厳格化によって支えられています。自治体水道事業体や産業事業者は、処理性能を向上させつつ汚泥管理費用を削減する先進的な凝集技術に、より多くの予算を割り当てています。同地域内では、米国において、処理施設の近代化と長期的なシステムの信頼性向上を目的とした公的資金による取り組みに支えられ、高性能PACグレードの採用が加速しています。
よくあるご質問
目次
第1章 調査手法
第2章 エグゼクティブサマリー
第3章 業界考察
- エコシステム分析
- サプライヤーの情勢
- 利益率
- 各段階における付加価値
- バリューチェーンに影響を与える要因
- ディスラプション
- 業界への影響要因
- 促進要因
- 業界の潜在的リスク&課題
- 市場機会
- 成長可能性分析
- 規制情勢
- 北米
- 欧州
- アジア太平洋地域
- ラテンアメリカ
- 中東・アフリカ
- ポーターの分析
- PESTEL分析
- 価格動向
- 地域別
- 製品別
- 将来の市場動向
- 技術およびイノベーションの動向
- 現在の技術動向
- 新興技術
- 特許動向
- 貿易統計(注:貿易統計は主要国のみ提供されます)
- 主要輸入国
- 主要な輸出国
- サステナビリティおよび環境面
- 持続可能な取り組み
- 廃棄物削減戦略
- 生産におけるエネルギー効率
- 環境配慮型イニシアチブ
- カーボンフットプリントに関する考察
第4章 競合情勢
- イントロダクション
- 企業の市場シェア分析
- 地域別
- 北米
- 欧州
- アジア太平洋地域
- ラテンアメリカ
- 中東・アフリカ
- 地域別
- 企業マトリックス分析
- 主要市場企業の競合分析
- 競合ポジショニングマトリックス
- 主な発展
- 合併・買収
- 提携・協業
- 新製品の発売
- 事業拡大計画
第5章 市場推計・予測:形態別、2022-2035
- 液体PAC
- 粉末PAC(噴霧乾燥)
- 粒状PAC
- フレーク状PAC(ドラム乾燥)
第6章 市場推計・予測:製品タイプ別、2022-2035
- ポリ塩化アルミニウム(PAC)
- ポリ塩化アルミニウム硫酸塩(PACS)
- 塩化アルミニウム水和物(ACH)
- 複合PAC
- ナノPAC
第7章 市場推計・予測:グレード別、2022-2035
- 食品用PAC
- 飲料水用PAC
- 工業用グレードPAC
- フィルターグレードPAC
第8章 市場推計・予測:塩基性別、2022-2035
- 低塩基性
- 中程度の塩基性
- 高塩基性
- 超高塩基性
第9章 市場推計・予測:製造プロセス別、2022-2035
- 噴霧乾燥技術
- ドラム乾燥技術
- 電気透析法
- 酸可溶性アルミニウム灰法
第10章 市場推計・予測:エンドユーザー産業別、2022-2035
- 水処理
- パルプ・製紙業界
- 繊維産業
- 石油・ガス産業
- 医薬品・化粧品
- その他
第11章 市場推計・予測:用途別、2022-2035
- 凝集・フロキュレーション
- 汚泥脱水
- 膜前処理
- リン除去
- 重金属除去
- 有機物およびNOM除去
- その他
第12章 市場推計・予測:地域別、2022-2035
- 北米
- 米国
- カナダ
- 欧州
- ドイツ
- 英国
- フランス
- イタリア
- スペイン
- その他欧州地域
- アジア太平洋地域
- 中国
- インド
- 日本
- オーストラリア
- 韓国
- その他アジア太平洋地域
- ラテンアメリカ
- ブラジル
- メキシコ
- アルゼンチン
- その他ラテンアメリカ地域
- 中東・アフリカ
- サウジアラビア
- 南アフリカ
- アラブ首長国連邦
- その他中東とアフリカ
第13章 企業プロファイル
- Alumichem A/S
- Biosynth
- CHALCO Advanced Material Co., Ltd.
- EMCO Dyestuff
- Fengchen Group Co.,Ltd
- GEO Specialty Chemicals
- Henan Chemger Group Corporation
- Henan Yuanbo Environmental Technology Co., Ltd.
- Kavya Pharma
- Kemira Oyj
- N. R. CHEMICALS
- Taki Chemical
- USALCO
- Venator Materials
