
|
市場調査レポート
商品コード
1685198
産業用ボイラーメンテナンス市場の機会、成長促進要因、産業動向分析、2025年~2034年の予測Industrial Boiler Maintenance Market Opportunity, Growth Drivers, Industry Trend Analysis, and Forecast 2025 - 2034 |
||||||
カスタマイズ可能
|
|||||||
| 産業用ボイラーメンテナンス市場の機会、成長促進要因、産業動向分析、2025年~2034年の予測 |
|
出版日: 2025年01月13日
発行: Global Market Insights Inc.
ページ情報: 英文 135 Pages
納期: 2~3営業日
|

全表示
- 概要
- 目次
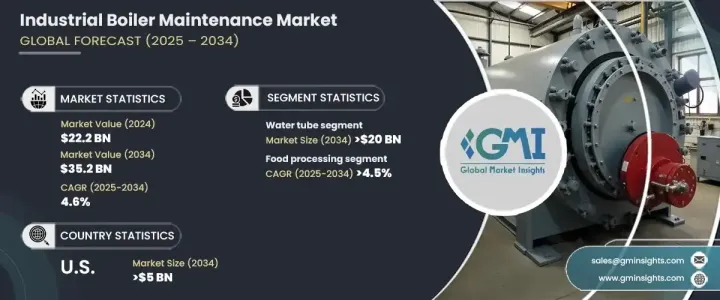
世界の産業用ボイラーメンテナンス市場は2024年に222億米ドルと評価され、2025年から2034年にかけて4.6%のCAGRが予測され、着実な拡大が見込まれています。
エネルギー効率の高いソリューションが重視されるようになったことで、高度なボイラー保守戦略の採用が増加しています。世界中の企業が、厳しい環境規制を満たしながら性能を最適化する費用対効果の高い方法を積極的に模索しています。持続可能性が最優先課題となる中、企業は故障予知管理、リアルタイム監視、自動化などの最先端技術を活用し、ダウンタイムを最小限に抑えて操業効率を向上させています。
食品加工、製油所、化学などの業界では、産業用ボイラーへの依存度が引き続き高く、メンテナンス・サービスへの旺盛な需要が生まれています。政府の好意的な政策がさらに市場拡大に寄与しており、環境および安全規制へのコンプライアンスを確保するために、企業が積極的なメンテナンス・ソリューションを採用することを奨励しています。極端な電圧と温度に耐えるように設計された産業用ボイラーは、運転の安全性と長寿命化に重要な役割を果たしています。企業は、ボイラーシステムの信頼性を高めるため、耐腐食性コーティングや最適化された修理技術など、高性能のメンテナンス・ソリューションに投資しています。
| 市場範囲 | |
|---|---|
| 開始年 | 2024 |
| 予測年 | 2025-2034 |
| 開始金額 | 222億米ドル |
| 予測金額 | 352億米ドル |
| CAGR | 4.6% |
産業オートメーション、人工知能、モノのインターネット(IoT)の進歩が、産業用ボイラーのメンテナンスの状況を変えつつあります。IoT対応の監視システムは、ボイラー性能に関するリアルタイムの洞察を提供し、コストのかかる故障を防ぐ予知保全を可能にします。クラウドベースの分析もまた、メンテナンス・スケジュールの最適化、計画外停止の削減、運用コストの削減に重要な役割を果たしています。産業界がデジタルトランスフォーメーションに向かう中、スマートテクノロジーの統合は今後10年間の市場成長を加速させると予想されます。
産業用ボイラーメンテナンス市場の水管セグメントは、2034年までに200億米ドルを生み出すと予測されています。安全規制の増加と環境基準の進化が、高度なメンテナンス・サービスへの需要を促進しています。企業は、耐食性を高め、ボイラー部品の寿命を延ばす革新的な材料や特殊コーティングに目を向けています。こうした進歩は、厳しい規制枠組みへの準拠を維持しながら、より高い効率を達成するのに役立っています。
食品加工産業は、産業用ボイラーメンテナンス市場において大きな成長を遂げることが予想され、2034年までの推定CAGRは4.5%です。加工食品に対する消費者需要の増加が、安定した生産量を維持できる高性能産業用ボイラーの必要性を高めています。高度な原料や革新的なボイラーメンテナンス技術の利用可能性が新たな加工施設への投資を促し、市場の拡大をさらに後押ししています。食品メーカーが効率と信頼性を優先するにつれ、ニーズに合わせたボイラーメンテナンス・サービスの需要が高まると予想されます。
米国の産業用ボイラーメンテナンス市場は、2034年までに50億米ドルに達すると予測されています。経済成長と産業の拡大により、定期的なメンテナンスやシステムのアップグレードに対する需要が高まっています。厳しい環境規制が施行される中、企業は排出基準や運転効率目標の遵守を確実にするため、ボイラー保守を優先しています。企業は、メンテナンス・プロセスの合理化、ダウンタイムの削減、持続可能性への取り組み強化のため、最先端の監視ソリューションと自動化の採用を増やしています。産業が進化する中、米国市場は産業用ボイラーメンテナンスの革新と効率化を推進する重要なプレーヤーであり続けています。
目次
第1章 調査手法と調査範囲
- 市場範囲と定義
- 市場推計・予測パラメータ
- 予測計算
- データソース
第2章 エグゼクティブサマリー
第3章 業界洞察
- エコシステム分析
- 規制状況
- 業界への影響要因
- 促進要因
- 業界の潜在的リスク&課題
- 成長ポテンシャル分析
- ポーター分析
- PESTEL分析
第4章 競合情勢
- イントロダクション
- 戦略的展望
- イノベーションと持続可能性の展望
第5章 市場規模・予測:製品別、2021年~2034年
- 主要動向
- 煙管
- 水管
第6章 市場規模・予測:用途別、2021年~2034年
- 主要動向
- 食品加工
- パルプ・製紙
- 化学
- 精製
- 第一次金属
- その他
第7章 市場規模・予測:地域別、2021年~2034年
- 主要動向
- 北米
- 米国
- カナダ
- メキシコ
- 欧州
- フランス
- 英国
- ポーランド
- イタリア
- スペイン
- オーストリア
- ドイツ
- スウェーデン
- ロシア
- アジア太平洋
- 中国
- インド
- フィリピン
- 日本
- 韓国
- オーストラリア
- インドネシア
- 中東・アフリカ
- サウジアラビア
- イラン
- アラブ首長国連邦
- エジプト
- ナイジェリア
- 南アフリカ
- ラテンアメリカ
- アルゼンチン
- チリ
- ブラジル
第8章 企業プロファイル
- ALFA LAVAL
- Babcock &Wilcox
- Babcock Wanson
- Bosch Industriekessel
- Boyle Services
- Burner Combustion
- Cleaver-Brooks
- Fulton
- Hurst Boiler &Welding
- Indeck Power Equipment
- John Wood Group
- Mitsubishi Heavy Industries
- Miura America
- Nationwide Boiler
- Power Mechanical
- Powerhouse Equipment &Engineering
- Rentech Boiler Systems
- Siemens
- Thermax
- Thermodyne Boilers
The Global Industrial Boiler Maintenance Market, valued at USD 22.2 billion in 2024, is poised for steady expansion, with a projected CAGR of 4.6% between 2025 and 2034. The growing emphasis on energy-efficient solutions is driving increased adoption of advanced boiler maintenance strategies. Businesses worldwide are actively seeking cost-effective methods to optimize performance while meeting stringent environmental regulations. As sustainability becomes a top priority, companies are leveraging cutting-edge technologies such as predictive failure management, real-time monitoring, and automation to minimize downtimes and improve operational efficiency.
Industries such as food processing, refineries, and chemicals continue to rely heavily on industrial boilers, creating a robust demand for maintenance services. Favorable government policies further contribute to market expansion, encouraging businesses to adopt proactive maintenance solutions to ensure compliance with environmental and safety regulations. Designed to withstand extreme voltages and temperatures, industrial boilers play a critical role in operational safety and longevity. Companies are investing in high-performance maintenance solutions, including corrosion-resistant coatings and optimized repair techniques, to enhance the reliability of their boiler systems.
| Market Scope | |
|---|---|
| Start Year | 2024 |
| Forecast Year | 2025-2034 |
| Start Value | $22.2 Billion |
| Forecast Value | $35.2 Billion |
| CAGR | 4.6% |
Advancements in industrial automation, artificial intelligence, and the Internet of Things (IoT) are transforming the industrial boiler maintenance landscape. IoT-enabled monitoring systems provide real-time insights into boiler performance, enabling predictive maintenance that prevents costly breakdowns. Cloud-based analytics are also playing a crucial role in optimizing maintenance schedules, reducing unplanned outages, and lowering operational costs. As industries move toward digital transformation, the integration of smart technologies is expected to accelerate market growth over the coming decade.
The water tube segment of the industrial boiler maintenance market is projected to generate USD 20 billion by 2034. Increasing safety regulations and evolving environmental standards are fueling the demand for advanced maintenance services. Companies are turning to innovative materials and specialized coatings that enhance corrosion resistance and prolong the lifespan of boiler components. These advancements are helping industries achieve greater efficiency while maintaining compliance with strict regulatory frameworks.
The food processing industry is set to experience significant growth in the industrial boiler maintenance market, with an estimated CAGR of 4.5% through 2034. Rising consumer demand for processed foods is driving the need for high-performance industrial boilers capable of maintaining consistent production outputs. The availability of advanced feedstocks and innovative boiler maintenance technologies is encouraging investments in new processing facilities, further boosting market expansion. As food manufacturers prioritize efficiency and reliability, the demand for tailored boiler maintenance services is expected to rise.
The U.S. industrial boiler maintenance market is forecasted to reach USD 5 billion by 2034. Economic growth and industrial expansion are creating heightened demand for routine maintenance and system upgrades. With stringent environmental regulations in place, businesses are prioritizing boiler maintenance to ensure compliance with emission standards and operational efficiency targets. Companies are increasingly adopting state-of-the-art monitoring solutions and automation to streamline maintenance processes, reduce downtime, and enhance sustainability efforts. As industries evolve, the U.S. market remains a key player in driving innovation and efficiency in industrial boiler maintenance.
Table of Contents
Chapter 1 Methodology & Scope
- 1.1 Market scope & definitions
- 1.2 Market estimates & forecast parameters
- 1.3 Forecast calculation
- 1.4 Data sources
- 1.4.1 Primary
- 1.4.2 Secondary
- 1.4.2.1 Paid
- 1.4.2.2 Public
Chapter 2 Executive Summary
- 2.1 Industry synopsis, 2021 - 2034
Chapter 3 Industry Insights
- 3.1 Industry ecosystem analysis
- 3.2 Regulatory landscape
- 3.3 Industry impact forces
- 3.3.1 Growth drivers
- 3.3.2 Industry pitfalls & challenges
- 3.4 Growth potential analysis
- 3.5 Porter's analysis
- 3.5.1 Bargaining power of suppliers
- 3.5.2 Bargaining power of buyers
- 3.5.3 Threat of new entrants
- 3.5.4 Threat of substitutes
- 3.6 PESTEL analysis
Chapter 4 Competitive Landscape, 2024
- 4.1 Introduction
- 4.2 Strategic outlook
- 4.3 Innovation & sustainability landscape
Chapter 5 Market Size and Forecast, By Product, 2021 – 2034 (USD Million)
- 5.1 Key trends
- 5.2 Fire tube
- 5.3 Water tube
Chapter 6 Market Size and Forecast, By Application, 2021 – 2034 (USD Million)
- 6.1 Key trends
- 6.2 Food processing
- 6.3 Pulp & paper
- 6.4 Chemical
- 6.5 Refinery
- 6.6 Primary METAL
- 6.7 Others
Chapter 7 Market Size and Forecast, By Region, 2021 – 2034 (USD Million)
- 7.1 Key trends
- 7.2 North America
- 7.2.1 U.S.
- 7.2.2 Canada
- 7.2.3 Mexico
- 7.3 Europe
- 7.3.1 France
- 7.3.2 UK
- 7.3.3 Poland
- 7.3.4 Italy
- 7.3.5 Spain
- 7.3.6 Austria
- 7.3.7 Germany
- 7.3.8 Sweden
- 7.3.9 Russia
- 7.4 Asia Pacific
- 7.4.1 China
- 7.4.2 India
- 7.4.3 Philippines
- 7.4.4 Japan
- 7.4.5 South Korea
- 7.4.6 Australia
- 7.4.7 Indonesia
- 7.5 Middle East & Africa
- 7.5.1 Saudi Arabia
- 7.5.2 Iran
- 7.5.3 UAE
- 7.5.4 Egypt
- 7.5.5 Nigeria
- 7.5.6 South Africa
- 7.6 Latin America
- 7.6.1 Argentina
- 7.6.2 Chile
- 7.6.3 Brazil
Chapter 8 Company Profiles
- 8.1 ALFA LAVAL
- 8.2 Babcock & Wilcox
- 8.3 Babcock Wanson
- 8.4 Bosch Industriekessel
- 8.5 Boyle Services
- 8.6 Burner Combustion
- 8.7 Cleaver-Brooks
- 8.8 Fulton
- 8.9 Hurst Boiler & Welding
- 8.10 Indeck Power Equipment
- 8.11 John Wood Group
- 8.12 Mitsubishi Heavy Industries
- 8.13 Miura America
- 8.14 Nationwide Boiler
- 8.15 Power Mechanical
- 8.16 Powerhouse Equipment & Engineering
- 8.17 Rentech Boiler Systems
- 8.18 Siemens
- 8.19 Thermax
- 8.20 Thermodyne Boilers

