
|
市場調査レポート
商品コード
1766340
局所麻酔薬の市場機会、成長促進要因、産業動向分析、2025年~2034年予測Local Anesthesia Drugs Market Opportunity, Growth Drivers, Industry Trend Analysis, and Forecast 2025 - 2034 |
||||||
カスタマイズ可能
|
|||||||
| 局所麻酔薬の市場機会、成長促進要因、産業動向分析、2025年~2034年予測 |
|
出版日: 2025年06月12日
発行: Global Market Insights Inc.
ページ情報: 英文 135 Pages
納期: 2~3営業日
|

全表示
- 概要
- 目次
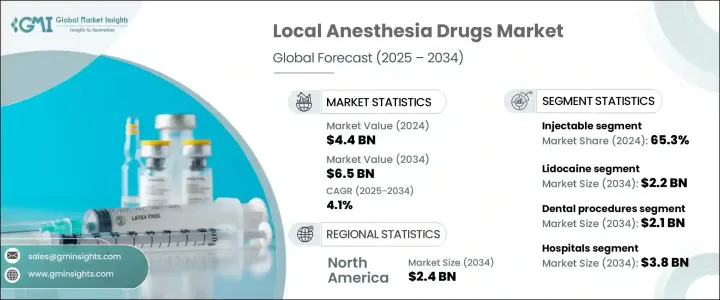
世界の局所麻酔薬市場は、2024年には44億米ドルと評価され、CAGR 4.1%で成長し、2034年には65億米ドルに達すると推定されています。
この成長は、様々なヘルスケア施設における手術や低侵襲処置の件数が増加していることが主な要因です。外来診療所、歯科医院、美容治療センターなどで、標的を絞った短期的な疼痛管理の需要が高まるにつれ、効果的な局所麻酔薬のニーズは着実に増え続けています。患者の早期回復を可能にし、全身麻酔に伴うリスクを回避する処置への嗜好の高まりが、局所麻酔製剤の広範な使用を後押ししています。全身への影響が少なく、部位特異的な手術を必要とすることが多い高齢者人口の増加も、市場拡大に寄与しています。さらに、新興国市場ではヘルスケアインフラの整備が進み、外科治療へのアクセスが向上していることも、これらの薬剤が広く採用されるための好条件となっています。
早期回復と入院期間の短縮が重視される価値観に基づくヘルスケアへのシフトにより、多くの治療で局所麻酔が優先的に選択されるようになっています。製薬会社は、麻酔製剤の有効性、効き目、持続時間を改善するための調査に積極的に投資しており、製品へのアクセスや臨床利用をさらに後押ししています。規制当局の支援と迅速な承認経路も、市場への浸透と技術革新を促進する上で重要な役割を果たしています。
| 市場範囲 | |
|---|---|
| 開始年 | 2024年 |
| 予測年 | 2025年~2034年 |
| 開始金額 | 44億米ドル |
| 予測金額 | 65億米ドル |
| CAGR | 4.1% |
局所麻酔とは、患者の全体的な意識に影響を与えることなく、身体の特定の部位を麻痺させる薬剤の投与を指します。これらの麻酔薬には、注射、外用液、スプレーなどさまざまな形態があります。このカテゴリーで一般的に使用される薬剤には、ブピバカイン、リドカイン、プリロカイン、ロピバカイン、ベンゾカイン、クロロプロカインなどがあります。
薬剤の種類に基づき、市場はブピバカイン、リドカイン、ベンゾカイン、プリロカイン、ロピバカイン、クロロプロカイン、その他の変種に区分されます。このうち、リドカインセグメントは2024年に15億米ドルで市場をリードし、2034年には22億米ドルに成長し、CAGR 3.7%で成長すると予測されています。リドカインは、特に小手術、皮膚科、歯科、疼痛管理など、その速効性、汎用性、幅広い用途により、最も広く使用されている局所麻酔薬の1つです。リドカイン製剤は注射剤と外用剤の両方が入手可能であるため、様々な医療分野でその魅力が増しています。
投与経路によって、局所麻酔薬は注射タイプと局所タイプに分けられます。注射剤は2024年に65.3%の最大シェアを占め、予測期間を通じてその優位性を維持すると予想されます。注射剤は、即効性、正確なターゲティング、神経ブロックや小外科的介入など数多くの臨床処置への適合性から広く好まれています。送達方法と徐放性製剤における継続的な技術革新が、特に外来患者や外科治療の現場での広範な使用をさらに後押ししています。
用途別では、市場は外科処置、歯科処置、美容・皮膚科処置、疼痛管理、その他に分類されます。歯科処置は2024年に市場の33.2%を占める主要セグメントとして浮上し、2034年には21億米ドルに達すると予測されています。局所麻酔は、根管治療、抜歯、虫歯の詰め物などの治療中の不快感を最小限に抑えることで、歯科治療を容易にする上で重要な役割を果たしています。このセグメントの隆盛は、口腔衛生問題の世界の負担の増大と、日常的な歯科治療へのアクセスの拡大によって後押しされています。
最終用途別に見ると、市場には病院、外来手術センター、その他のヘルスケアプロバイダーが含まれます。病院は2024年に56.2%と圧倒的なシェアを占め、2034年までに38億米ドルの売上を生み出し、CAGR 4.4%で成長すると予想されています。病院は、局所麻酔を必要とするさまざまな外科手術や診断処置の主要な場所としての役割を果たし続けています。高度な手術インフラ、訓練を受けた専門家、包括的な医療サービスを利用できることから、主要なエンドユーザーとしての地位は揺るぎないものとなっています。
地域別では、北米が2024年に17億米ドルの収益を上げて世界市場をリードし、CAGR 3.8%で拡大しながら2034年には24億米ドルに達すると予測されています。同地域は、ヘルスケアシステムが発達していること、局所疼痛管理ソリューションに対する認識が高まっていること、局所麻酔を使用する医療・外科手術の頻度が高いことなどの利点があります。着実な研究開発活動と大手製薬企業の存在も、この地域の市場牽引に大きく貢献しています。
市場は適度に統合されており、上位5社で全体の約55%のシェアを占めています。ファイザー、Fresenius Kabi、B. Braun Melsungen、Septodont、Pacira Biosciencesなどの主要企業は、市場シェアを拡大するため、技術革新、世界なプレゼンス、戦略的提携に基づいて競争を続けています。製品ラインの拡大、新市場への参入、製造能力の強化に向けた各社の継続的な取り組みが、今後数年間の市場ダイナミクスに影響を与えると予想されます。
目次
第1章 調査手法と範囲
第2章 エグゼクティブサマリー
第3章 業界考察
- エコシステム分析
- 業界への影響要因
- 促進要因
- 手術件数の増加
- 高齢者人口に有利な状況
- オピオイドよりも局所麻酔薬の好ましさが高まっている
- ドラッグデリバリーの進歩が需要を牽引
- 業界の潜在的リスク&課題
- 用量依存的な副作用と限られた作用持続時間
- 厳格な規制の複雑さ
- 市場機会
- 美容施術の拡大
- 長時間作用型麻酔薬の開発
- 促進要因
- 成長可能性分析
- パイプライン分析
- 将来の市場動向
- 規制情勢
- ポーター分析
- PESTEL分析
第4章 競合情勢
- イントロダクション
- 企業マトリックス分析
- 主要市場企業の競合分析
- 競合ポジショニングマトリックス
- 主な発展
第5章 市場推計・予測:薬剤タイプ別、2021年~2034年
- 主要動向
- リドカイン
- ブピバカイン
- ベンゾカイン
- ロピバカイン
- プリロカイン
- クロロプロカイン
- その他の薬剤タイプ
第6章 市場推計・予測:投与経路別、2021年~2034年
- 主要動向
- トピック
- 注射剤
第7章 市場推計・予測:用途別、2021年~2034年
- 主要動向
- 歯科処置
- 外科手術
- 美容および皮膚科処置
- 疼痛管理
- その他の用途
第8章 市場推計・予測:最終用途別、2021年~2034年
- 主要動向
- 病院
- 外来手術センター
- 歯科医院
- その他の用途
第9章 市場推計・予測:地域別、2021年~2034年
- 主要動向
- 北米
- 米国
- カナダ
- 欧州
- ドイツ
- 英国
- フランス
- スペイン
- イタリア
- オランダ
- アジア太平洋
- 中国
- 日本
- インド
- オーストラリア
- 韓国
- ラテンアメリカ
- ブラジル
- メキシコ
- アルゼンチン
- 中東・アフリカ
- 南アフリカ
- サウジアラビア
- アラブ首長国連邦
第10章 企業プロファイル
- AbbVie
- AdvaCare
- Aspen Pharmacare
- B. Braun Melsungen
- Baxter
- Fresenius Kabi
- GE Healthcare
- HANSAmed
- Hikima
- Pacira BioSciences
- Pfizer
- Pierrel Spa
- Piramal
- Septodont
The Global Local Anesthesia Drugs Market was valued at USD 4.4 billion in 2024 and is estimated to grow at a CAGR of 4.1% to reach USD 6.5 billion by 2034. This growth is largely attributed to the rising volume of surgeries and minimally invasive procedures across various healthcare facilities. As demand rises for targeted and short-term pain management in outpatient clinics, dental offices, and cosmetic treatment centers, the need for effective local anesthetics continues to grow steadily. An increasing preference for procedures that allow quicker patient recovery and avoid the risks associated with general anesthesia is helping drive the widespread use of local anesthetic formulations. The growing population of older adults, who often require site-specific surgeries with fewer systemic effects, is another factor contributing to the market expansion. Additionally, ongoing development in healthcare infrastructure and access to surgical care in emerging markets are creating favorable conditions for the broader adoption of these drugs.
The shift toward value-based healthcare, where quicker recovery and shorter hospital stays are emphasized, has made local anesthesia a preferred choice in many treatments. Pharmaceutical companies are actively investing in research to improve the efficacy, onset, and duration of anesthetic formulations, further boosting product accessibility and clinical use. Regulatory support and faster approval pathways are also playing a vital role in facilitating market penetration and technological innovation.
| Market Scope | |
|---|---|
| Start Year | 2024 |
| Forecast Year | 2025-2034 |
| Start Value | $4.4 Billion |
| Forecast Value | $6.5 Billion |
| CAGR | 4.1% |
Local anesthesia refers to the administration of drugs that numb a specific part of the body without affecting the patient's overall consciousness. These anesthetics come in various forms, including injections, topical solutions, and sprays. Commonly used drugs in this category include bupivacaine, lidocaine, prilocaine, ropivacaine, benzocaine, and chloroprocaine.
Based on drug type, the market is segmented into bupivacaine, lidocaine, benzocaine, prilocaine, ropivacaine, chloroprocaine, and other variants. Among these, the lidocaine segment led the market with a value of USD 1.5 billion in 2024 and is expected to grow to USD 2.2 billion by 2034, advancing at a CAGR of 3.7%. Lidocaine remains one of the most extensively used local anesthetics due to its rapid onset, versatility, and wide range of applications, particularly in minor surgeries, dermatology, dentistry, and pain management. The availability of both injectable and topical lidocaine formulations adds to its appeal in various medical specialties.
By route of administration, local anesthetics are divided into injectable and topical types. The injectable segment held the largest share of 65.3% in 2024 and is expected to maintain its dominance throughout the forecast period. Injectables are widely preferred for their quick action, precise targeting, and suitability across numerous clinical procedures, such as nerve blocks and minor surgical interventions. Continuous innovation in delivery methods and extended-release formulations is further supporting their widespread use, particularly in outpatient and surgical care settings.
In terms of application, the market is classified into surgical procedures, dental procedures, cosmetic and dermatological procedures, pain management, and others. Dental procedures emerged as the leading segment in 2024, accounting for 33.2% of the market and projected to reach USD 2.1 billion by 2034. Local anesthesia plays a critical role in facilitating dental care by minimizing discomfort during treatments such as root canals, extractions, and cavity fillings. This segment's prominence is fueled by the increasing global burden of oral health issues and greater access to routine dental care.
According to end use, the market includes hospitals, ambulatory surgical centers, and other healthcare providers. Hospitals represented the dominant share of 56.2% in 2024 and are expected to generate USD 3.8 billion in revenue by 2034, growing at a CAGR of 4.4%. Hospitals continue to serve as the primary site for various surgical and diagnostic procedures that demand the use of local anesthesia. The availability of advanced surgical infrastructure, trained professionals, and comprehensive medical services solidifies their position as a key end-user segment.
Regionally, North America led the global market with USD 1.7 billion in revenue in 2024 and is forecast to reach USD 2.4 billion by 2034, expanding at a CAGR of 3.8%. The region benefits from well-developed healthcare systems, increased awareness regarding localized pain management solutions, and a high frequency of medical and surgical procedures that utilize local anesthesia. Steady R&D activities and the presence of leading pharmaceutical players also contribute significantly to the region's market leadership.
The market is moderately consolidated, with the top five players accounting for approximately 55% of the overall share. Key companies such as Pfizer, Fresenius Kabi, B. Braun Melsungen, Septodont, and Pacira Biosciences continue to compete based on innovation, global presence, and strategic collaborations to capture greater market share. Their ongoing efforts in expanding product lines, entering new markets, and enhancing manufacturing capabilities are expected to influence market dynamics over the coming years.
Table of Contents
Chapter 1 Methodology and Scope
- 1.1 Market scope and definition
- 1.2 Research design
- 1.2.1 Research approach
- 1.2.2 Data collection methods
- 1.3 Data mining sources
- 1.3.1 Global
- 1.3.2 Regional/Country
- 1.4 Base estimates and calculations
- 1.4.1 Base year calculation
- 1.4.2 Key trends for market estimation
- 1.5 Primary research and validation
- 1.5.1 Primary sources
- 1.6 Forecast model
- 1.7 Research assumptions and limitations
Chapter 2 Executive Summary
- 2.1 Industry 3600 synopsis
- 2.2 Key market trends
- 2.2.1 Regional
- 2.2.2 Drug type
- 2.2.3 Route of administration
- 2.2.4 Application
- 2.2.5 End use
- 2.3 CXO perspectives: Strategic imperatives
- 2.3.1 Key decision points for industry executives
- 2.3.2 Critical success factors for market players
- 2.4 Future outlook and strategic recommendations
Chapter 3 Industry Insights
- 3.1 Industry ecosystem analysis
- 3.2 Industry impact forces
- 3.2.1 Growth drivers
- 3.2.1.1 Rising surgical volume
- 3.2.1.2 Favorable geriatric demographics
- 3.2.1.3 Increasing preference for local anesthetics over opioids
- 3.2.1.4 Advancement in drug delivery drives the demand
- 3.2.2 Industry pitfalls and challenges
- 3.2.2.1 Dose dependent side effects and limited duration of action
- 3.2.2.2 Stringent regulatory complexities
- 3.2.3 Market opportunities
- 3.2.3.1 Expanding aesthetic procedures
- 3.2.3.2 Development of long-acting anesthetics
- 3.2.1 Growth drivers
- 3.3 Growth potential analysis
- 3.4 Pipeline analysis
- 3.5 Future market trends
- 3.6 Regulatory landscape
- 3.7 Porter's analysis
- 3.8 PESTEL analysis
Chapter 4 Competitive Landscape, 2024
- 4.1 Introduction
- 4.2 Company matrix analysis
- 4.3 Competitive analysis of major market players
- 4.4 Competitive positioning matrix
- 4.5 Key developments
Chapter 5 Market Estimates and Forecast, By Drug Type, 2021 - 2034 ($ Mn)
- 5.1 Key trends
- 5.2 Lidocaine
- 5.3 Bupivacaine
- 5.4 Benzocaine
- 5.5 Ropivacaine
- 5.6 Prilocaine
- 5.7 Chloroprocaine
- 5.8 Other drug types
Chapter 6 Market Estimates and Forecast, By Route of Administration, 2021 - 2034 ($ Mn)
- 6.1 Key trends
- 6.2 Topical
- 6.3 Injectable
Chapter 7 Market Estimates and Forecast, By Application, 2021 - 2034 ($ Mn)
- 7.1 Key trends
- 7.2 Dental procedures
- 7.3 Surgical procedures
- 7.4 Cosmetic and dermatological procedures
- 7.5 Pain management
- 7.6 Other applications
Chapter 8 Market Estimates and Forecast, By End Use, 2021 - 2034 ($ Mn)
- 8.1 Key trends
- 8.2 Hospitals
- 8.3 Ambulatory surgical centers
- 8.4 Dental clinics
- 8.5 Other end use
Chapter 9 Market Estimates and Forecast, By Region, 2021 - 2034 ($ Mn)
- 9.1 Key trends
- 9.2 North America
- 9.2.1 U.S.
- 9.2.2 Canada
- 9.3 Europe
- 9.3.1 Germany
- 9.3.2 UK
- 9.3.3 France
- 9.3.4 Spain
- 9.3.5 Italy
- 9.3.6 Netherlands
- 9.4 Asia Pacific
- 9.4.1 China
- 9.4.2 Japan
- 9.4.3 India
- 9.4.4 Australia
- 9.4.5 South Korea
- 9.5 Latin America
- 9.5.1 Brazil
- 9.5.2 Mexico
- 9.5.3 Argentina
- 9.6 Middle East and Africa
- 9.6.1 South Africa
- 9.6.2 Saudi Arabia
- 9.6.3 UAE
Chapter 10 Company Profiles
- 10.1 AbbVie
- 10.2 AdvaCare
- 10.3 Aspen Pharmacare
- 10.4 B. Braun Melsungen
- 10.5 Baxter
- 10.6 Fresenius Kabi
- 10.7 GE Healthcare
- 10.8 HANSAmed
- 10.9 Hikima
- 10.10 Pacira BioSciences
- 10.11 Pfizer
- 10.12 Pierrel Spa
- 10.13 Piramal
- 10.14 Septodont

