
|
市場調査レポート
商品コード
1892843
グルメソルト市場の機会、成長要因、業界動向分析、および2026年から2035年までの予測Gourmet Salts Market Opportunity, Growth Drivers, Industry Trend Analysis, and Forecast 2026 - 2035 |
||||||
カスタマイズ可能
|
|||||||
| グルメソルト市場の機会、成長要因、業界動向分析、および2026年から2035年までの予測 |
|
出版日: 2025年12月08日
発行: Global Market Insights Inc.
ページ情報: 英文 210 Pages
納期: 2~3営業日
|

概要
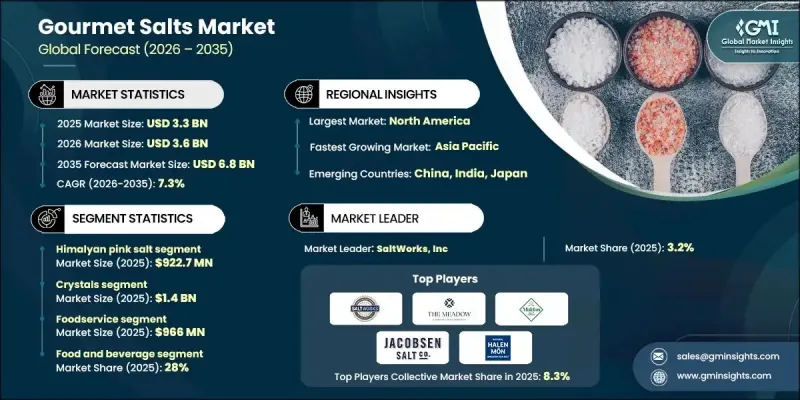
世界のグルメソルト市場は、2025年に33億米ドルと評価され、2035年までにCAGR7.3%で成長し、68億米ドルに達すると予測されています。
グルメソルトは、その独特のミネラル組成、色合い、質感、風味によって標準的な食卓塩とは一線を画しています。これらの塩には、味と見た目の両方を高める天然の微量ミネラルや特定の結晶パターンが含まれていることが多く、多くの場合、特定の海洋環境、古代の塩田、または火山地域から採取されるため、特産食品や高級ワインのように独特のテロワール(土地の特性)を持っています。採取、脱水、結晶形成における技術的進歩により、生産者はこれらの塩の粒度、質感、品質を精密に制御できるようになりました。高度な鉱物分析と電子商取引プラットフォームの普及により世界の入手可能性が拡大し、粗粒から微粒まで多様な質感は様々な料理用途に対応しています。例えばフレーク状の塩は繊細な食感を持ち、料理の仕上げ塩として非常に高い需要があります。
| 市場範囲 | |
|---|---|
| 開始年 | 2025年 |
| 予測年度 | 2026-2035 |
| 開始時価値 | 33億米ドル |
| 予測金額 | 68億米ドル |
| CAGR | 7.3% |
ヒマラヤピンクソルトセグメントは2025年に9億2,270万米ドルの市場規模を生み出しました。本市場は海塩、フレークソルト、その他の特殊品種を含む幅広い塩類を網羅しており、自然由来で最小限の加工を施したミネラル豊富な食材への消費者嗜好の高まりが牽引しています。これらの塩類は味や見た目の美しさだけでなく、プロの厨房から家庭のキッチンに至るまで、料理体験全体の向上に寄与する点で高く評価されています。
外食産業セグメントは2025年に9億6,600万米ドルに達しました。レストランやケータリングサービスが需要を牽引しており、シェフが高品質な食材を優先して飲食体験を向上させているためです。家庭の消費者も料理や食卓用としてグルメソルトの利用を増加させており、化粧品・パーソナルケア業界ではミネラル豊富な塩をバス用品やスキンケア製品に活用しています。幅広い用途が、変化する消費者の嗜好や健康志向の動向に後押しされ、着実な成長と革新を支えています。
米国高級塩市場は2025年に10億7,000万米ドル規模に達しました。北米の消費者は風味、美的魅力、機能性効果を理由に塩への関心を高めています。燻製塩やフレーバー塩は日常料理に深みを加えるため人気があり、ミネラル強化塩は健康製品に配合されています。専門店やオンラインマーケットプレースによる高級塩の普及が市場の成長と認知度向上を支えています。
よくあるご質問
目次
第1章 調査手法と範囲
第2章 エグゼクティブサマリー
第3章 業界考察
- エコシステム分析
- サプライヤーの情勢
- 利益率
- 各段階における付加価値
- バリューチェーンに影響を与える要因
- ディスラプション
- 業界への影響要因
- 促進要因
- 自然派製品に対する消費者嗜好の高まり
- 高級料理分野からの需要
- 電子商取引および小売チャネルの拡大
- 業界の潜在的リスク&課題
- 品質と真正性に関する懸念
- 貯蔵および保存期間に関する課題
- 市場機会
- 製品革新とフレーバーソルト
- 持続可能かつ環境に配慮した取り組み
- 新興市場への進出
- 促進要因
- 成長可能性分析
- 規制情勢
- 北米
- 欧州
- アジア太平洋地域
- ラテンアメリカ
- 中東・アフリカ
- ポーター分析
- PESTEL分析
- 技術とイノベーションの動向
- 現在の技術動向
- 新興技術
- 価格動向
- 地域別
- 製品タイプ別
- 将来の市場動向
- 技術とイノベーションの動向
- 現在の技術動向
- 新興技術
- 特許状況
- 貿易統計(HSコード)(注:貿易統計は主要国のみ提供されます)
- 主要輸入国
- 主要輸出国
- 持続可能性と環境面
- 持続可能な取り組み
- 廃棄物削減戦略
- 生産におけるエネルギー効率
- 環境に配慮した取り組み
- カーボンフットプリントへの配慮
第4章 競合情勢
- イントロダクション
- 企業の市場シェア分析
- 地域別
- 北米
- 欧州
- アジア太平洋地域
- ラテンアメリカ
- 中東・アフリカ地域
- 地域別
- 企業マトリクス分析
- 主要市場企業の競合分析
- 競合ポジショニングマトリックス
- 主な発展
- 合併・買収
- 提携・協業
- 新製品の発売
- 拡大計画
第5章 市場推計・予測:製品タイプ別、2022-2035
- 主要動向
- 海塩
- フルール・ド・セル
- セル・グリ(ケルティック・グレイソルト)
- ヒマラヤピンクソルト
- フレークソルト
- ハワイアンソルト(赤/黒)
- 燻製塩
- ブラックソルト(カラナマック)
- フレーバー&インフューズドソルト
第6章 市場推計・予測:製品形態別、2022-2035
- 主要動向
- 結晶
- フレーク
- 粉末
第7章 市場推計・予測:用途別、2022-2035
- 主要動向
- 製パン・菓子類
- 肉・家禽製品
- 水産加工品
- ソース・調味料
- 食品加工
- 外食産業
- 家庭用/小売
- 化粧品・パーソナルケア
第8章 市場推計・予測:最終用途産業別、2022-2035
- 主要動向
- 飲食品業界
- プロフェッショナルな料理および高級レストラン
- 専門食品製造
- ホスピタリティ業界
- 小売消費者
- 健康・ウェルネス
第9章 市場推計・予測:地域別、2022-2035
- 主要動向
- 北米
- 米国
- カナダ
- メキシコ
- 欧州
- ドイツ
- 英国
- フランス
- スペイン
- イタリア
- その他欧州地域
- アジア太平洋地域
- 中国
- インド
- 日本
- オーストラリア
- 韓国
- その他アジア太平洋地域
- ラテンアメリカ
- ブラジル
- メキシコ
- アルゼンチン
- その他ラテンアメリカ地域
- 中東・アフリカ
- サウジアラビア
- 南アフリカ
- アラブ首長国連邦
- その他中東・アフリカ地域
第10章 企業プロファイル
- Alaska Pure Sea Salt Company
- Amagansett Sea Salt Co.
- Bitterman Salt Co.
- Brittany Sea Salt
- Celtic Sea Salt
- Cargill Inc./Morton Salt
- Cheetham Salt Limited
- Gilles Hervy
- Halen Mon
- Infosa
- Jacobsen Salt Co.
- Le Guerandais
- Louis Sel
- Maldon Crystal Salt Company Ltd.
- Murray River Salt(Sun Salt Pty Ltd)
- Pyramid Salt(Sun Salt/Pyramid Hill)
- Redmond Real Salt(Redmond Life)
- SaltWorks, Inc.
- San Francisco Salt Company
- Sassi Salts
- The Meadow
- The Salt Table

