|
|
市場調査レポート
商品コード
1402413
香料の世界市場:用途別、タイプ別、成長見通し、地域別展望、予測(2023年~2032年)Flavoring Agents Market Size - By Application, Type, Growth Prospects, Regional Outlook & Forecast, 2023-2032 |
||||||
|
|
|||||||
カスタマイズ可能
|
|||||||


| 香料の世界市場:用途別、タイプ別、成長見通し、地域別展望、予測(2023年~2032年) |
|
出版日: 2023年11月20日
発行: Global Market Insights Inc.
ページ情報: 英文 300 Pages
納期: 2~3営業日
|

- 全表示
- 概要
- 図表
- 目次
世界の香料の市場規模は、独創的な技術革新と香料開発における広範な研究に後押しされ、2023年~2032年に4.5%超のCAGRを記録する見通しです。
味の強化に焦点を当て、技術や原料の進歩が風味のプロファイルを再定義します。
例えば、2023年8月、 Banaras Hindu Universityの学者が、強力な抗酸化作用、抗菌作用、抗がん作用を誇るココナッツコイア由来の香料化合物を調合しました。研究チームは、廃棄された寺院のココナッツコイアを発酵食品香料製造の基盤として利用しました。彼らの研究成果は、『Bioresource Technology』、『Food Biotechnology』、『Applied Food Biotechnology』などの著名な学術誌で紹介されています。これらの研究結果は、食品加工や医薬品の分野に大きな利益と進歩をもたらす、大きな可能性を秘めています。
天然抽出物から合成化合物まで、こうしたイノベーションは進化する消費者の嗜好に対応し、市場の成長を促進します。味覚と嗜好の研究が深まるにつれて、市場はユニークで多様な香料の急増を目の当たりにし、料理と飲料の幅広い用途で斬新な味覚体験の需要に応えています。
2023年~2032年に、セイボリー食品とコンビニエンス食品の分野が大きく発展する見込みです。消費者が味と利便性を優先する中、香料はこれらの食品カテゴリーを強化する上で極めて重要な役割を果たします。インスタント食品からスナックに至るまで、これらの香料は風味を高め、多様な味覚プロファイルと料理体験の需要に応えます。市場は、風味豊かで便利な食品を選択することが最も重要である現代のライフスタイルに対応し、風味豊かな料理や持ち帰り用のオプションに合わせた革新的な風味を提供し、適応しています。この動向は、消費者の嗜好と市場成長の形成に香料が不可欠な役割を果たしていることを裏付けています。
人工香料分野の香料市場規模は、2023年~2032年に顕著なCAGRを記録する見通しです。天然香料か人工香料かという議論はあるもの、人工香料の汎用性は、一貫した味覚プロファイルとコスト効率の高いソリューションを求めるメーカーに魅力的です。天然香料を模倣する技術の進歩により、人工香料は飲食品から加工食品まで様々な産業に対応しています。その安定性と世界各地の料理への幅広い応用が、人工香料の採用拡大を後押ししています。これは、親しみやすく多様な味覚体験を求める消費者の欲求を満たすために、市場が人工香料に依存していることを反映しています。
欧州の香料業界は、2023年~2032年に顕著なCAGRを示すと思われます。豊かな食の伝統によって形成された欧州の消費者は、多様で本物の味覚体験を求めています。この需要が市場成長の原動力となり、香料の技術革新に拍車をかけています。伝統的な香料からエキゾチックな香料まで、市場は飲食品における多様な嗜好に対応しています。
欧州では美食文化が根付いているため、同大陸の料理探求志向と洗練された味覚嗜好を反映した、高品質でニュアンスのある風味プロファイルを提供することで市場が繁栄しています。例えば、2023年4月、生物学主導のイノベーションで知られるInsempraは、バイオテクノロジーを駆使した天然香料成分、α-イオノンを発表しました。Phytowelt Green Technologiesによって開発されたこのEUナチュラル認証、ヴィーガン、食品グレードの成分は、Insempraの食品・美容市場への進出を示すものです。
目次
第1章 調査手法と調査範囲
第2章 エグゼクティブサマリー
第3章 香料の業界洞察
- 業界セグメンテーション
- 業界情勢(2018年~2032年)
- 業界エコシステム分析(2022年)
- 原料サプライヤー
- 製造業者
- 流通チャネル分析
- 利益率分析
- ベンダーマトリックス
- テクノロジー情勢
- 原材料分析
- 世界の飲食品業界の展望
- 規制状況
- 価格分析(2018年~2032年)
- 地域価格
- コスト構造分析(2022年)
- 業界への影響要因
- 促進要因
- 業界の潜在的リスクと課題
- 成長可能性分析(2022年)
- ポーターの分析
- 競合情勢(2022年)
- 企業シェア分析(2022年)
- 戦略ダッシュボード
- 主要ステークホルダー
- PESTEL分析
第4章 香料市場:用途別
- 世界の香料市場シェア:用途別(2022年・2032年)
- 飲料
- ベーカリー
- 乳製品
- セイボリー・コンビニエンス食品
- 菓子類
- 食肉
- 口腔衛生・医薬品
- スナック菓子
- その他(タバコ、幼児食、飼料)
第5章 香料市場:タイプ別
- 世界の香料市場シェア:タイプ別(2022年・2032年)
- 天然香料
- 人工香料
第6章 香料市場:地域別
- 世界の香料市場シェア:地域別(2022年・2032年)
- 北米
- 米国
- カナダ
- 欧州
- ドイツ
- 英国
- フランス
- イタリア
- スペイン
- オランダ
- ポーランド
- ロシア
- アジア太平洋
- 中国
- インド
- 日本
- 韓国
- オーストラリア
- インドネシア
- タイ
- ラテンアメリカ
- ブラジル
- アルゼンチン
- メキシコ
- 中東・アフリカ(MEA)
- サウジアラビア
- アラブ首長国連邦
- 南アフリカ
- エジプト
第7章 企業プロファイル
- Givaudan
- International Flavors & Fragrances, Inc.
- Firmenich
- Symrise AG
- Mane SA
- Takasago International Corporation
- Sensient Flavors
- Robertet SA
- T. Hasegawa Co. Ltd.
- Huabao International Holdings Limited
- Keva Flavours Private Limited
- Kerry Group
- Flavorcan International Inc.
Data Tables
- TABLE 1. Flavoring agents industry 360 degree synopsis, 2018 -2032
- TABLE 2. Global flavoring agents market estimates & forecast, 2018 -2032, (Kilo Tons) (USD Million)
- TABLE 3. Global flavoring agents market estimates & forecast by application, 2018 -2032 (Kilo Tons)
- TABLE 4. Global flavoring agents market estimates & forecast by application, 2018 -2032 (USD Million)
- TABLE 5. Global flavoring agents market estimates & forecast by type, 2018 -2032 (Kilo Tons)
- TABLE 6. Global flavoring agents market estimates & forecast by type, 2018 -2032 (USD Million)
- TABLE 7. Global flavoring agents market estimates & forecast by region, 2018 -2032 (Kilo Tons)
- TABLE 8. Global flavoring agents market estimates & forecast by region, 2018 -2032 (USD Million)
- TABLE 9. Vendor matrix
- TABLE 10. Pricing analysis, 2018 -2032
- TABLE 11. Industry impact forces
- TABLE 12. Top players overview
- TABLE 13. Strategy dashboard
- TABLE 14. Key stakeholders
- TABLE 15. Global flavoring agents market from beverages estimates & forecast, (Kilo Tons) (USD Million), 2018 -2032
- TABLE 16. Global flavoring agents market from beverages estimates & forecast by region, (Kilo Tons), 2018 -2032
- TABLE 17. Global flavoring agents market from beverages estimates & forecast by region, (USD Million), 2018 -2032
- TABLE 18. Global flavoring agents market from bakery estimates & forecast, (Kilo Tons) (USD Million), 2018 -2032
- TABLE 19. Global flavoring agents market from bakery estimates & forecast by region, (Kilo Tons), 2018 -2032
- TABLE 20. Global flavoring agents market from bakery estimates & forecast by region, (USD Million), 2018 -2032
- TABLE 21. Global flavoring agents market from dairy estimates & forecast, (Kilo Tons) (USD Million), 2018 -2032
- TABLE 22. Global flavoring agents market from dairy estimates & forecast by region, (Kilo Tons), 2018 -2032
- TABLE 23. Global flavoring agents market from dairy estimates & forecast by region, (USD Million), 2018 -2032
- TABLE 24. Global flavoring agents market from savory & convenience foods estimates & forecast, (Kilo Tons) (USD Million), 2018 -2032
- TABLE 25. Global flavoring agents market from savory & convenience foods estimates & forecast by region, (Kilo Tons), 2018 -2032
- TABLE 26. Global flavoring agents market from savory & convenience foods estimates & forecast by region, (USD Million), 2018 -2032
- TABLE 27. Global flavoring agents market from confectionery estimates & forecast, (Kilo Tons) (USD Million), 2018 -2032
- TABLE 28. Global flavoring agents market from confectionery estimates & forecast by region, (Kilo Tons), 2018 -2032
- TABLE 29. Global flavoring agents market from confectionery estimates & forecast by region, (USD Million), 2018 -2032
- TABLE 30. Global flavoring agents market from meat estimates & forecast, (Kilo Tons) (USD Million), 2018 -2032
- TABLE 31. Global flavoring agents market from meat estimates & forecast by region, (Kilo Tons), 2018 -2032
- TABLE 32. Global flavoring agents market from meat estimates & forecast by region, (USD Million), 2018 -2032
- TABLE 33. Global flavoring agents market from oral hygiene/ pharmaceutical estimates & forecast, (Kilo Tons) (USD Million), 2018 -2032
- TABLE 34. Global flavoring agents market from oral hygiene/ pharmaceutical estimates & forecast by region, (Kilo Tons), 2018 -2032
- TABLE 35. Global flavoring agents market from oral hygiene/ pharmaceutical estimates & forecast by region, (USD Million), 2018 -2032
- TABLE 36. Global flavoring agents market from snacks estimates & forecast, (Kilo Tons) (USD Million), 2018 -2032
- TABLE 37. Global flavoring agents market from snacks estimates & forecast by region, (Kilo Tons), 2018 -2032
- TABLE 38. Global flavoring agents market from snacks estimates & forecast by region, (USD Million), 2018 -2032
- TABLE 39. Global flavoring agents market from other applications estimates & forecast, (Kilo Tons) (USD Million), 2018 -2032
- TABLE 40. Global flavoring agents market from other applications estimates & forecast by region, (Kilo Tons), 2018 -2032
- TABLE 41. Global flavoring agents market from other applications estimates & forecast by region, (USD Million), 2018 -2032
- TABLE 42. Global flavoring agents market from natural flavors estimates & forecast, (Kilo Tons) (USD Million), 2018 -2032
- TABLE 43. Global flavoring agents market from natural flavors estimates & forecast by region, (Kilo Tons), 2018 -2032
- TABLE 44. Global flavoring agents market from natural flavors estimates & forecast by region, (USD Million), 2018 -2032
- TABLE 45. Global flavoring agents market from artificial flavors estimates & forecast, (Kilo Tons) (USD Million), 2018 -2032
- TABLE 46. Global flavoring agents market from artificial flavors estimates & forecast by region, (Kilo Tons), 2018 -2032
- TABLE 47. Global flavoring agents market from artificial flavors estimates & forecast by region, (USD Million), 2018 -2032
- TABLE 48. North America flavoring agents market estimates & forecast, 2018 -2032 (Kilo Tons) (USD Million)
- TABLE 49. North America flavoring agents market estimates & forecast by application, 2018 -2032 (Kilo Tons)
- TABLE 50. North America flavoring agents market estimates & forecast by application, 2018 -2032 (USD Million)
- TABLE 51. North America flavoring agents market estimates & forecast by type, 2018 -2032 (Kilo Tons)
- TABLE 52. North America flavoring agents market estimates & forecast by type, 2018 -2032 (USD Million)
- TABLE 53. U.S. flavoring agents market estimates & forecast, 2018 -2032 (Kilo Tons) (USD Million)
- TABLE 54. U.S. flavoring agents market estimates & forecast by application, 2018 -2032 (Kilo Tons)
- TABLE 55. U.S. flavoring agents market estimates & forecast by application, 2018 -2032 (USD Million)
- TABLE 56. U.S. flavoring agents market estimates & forecast by type, 2018 -2032 (Kilo Tons)
- TABLE 57. U.S. flavoring agents market estimates & forecast by type, 2018 -2032 (USD Million)
- TABLE 58. Canada flavoring agents market estimates & forecast, 2018 -2032 (Kilo Tons) (USD Million)
- TABLE 59. Canada flavoring agents market estimates & forecast by application, 2018 -2032 (Kilo Tons)
- TABLE 60. Canada flavoring agents market estimates & forecast by application, 2018 -2032 (USD Million)
- TABLE 61. Canada flavoring agents market estimates & forecast by type, 2018 -2032 (Kilo Tons)
- TABLE 62. Canada flavoring agents market estimates & forecast by type, 2018 -2032 (USD Million)
- TABLE 63. Germany flavoring agents market estimates & forecast, 2018 -2032 (Kilo Tons) (USD Million)
- TABLE 64. Germany flavoring agents market estimates & forecast by application, 2018 -2032 (Kilo Tons)
- TABLE 65. Germany flavoring agents market estimates & forecast by application, 2018 -2032 (USD Million)
- TABLE 66. Germany flavoring agents market estimates & forecast by type, 2018 -2032 (Kilo Tons)
- TABLE 67. Germany flavoring agents market estimates & forecast by type, 2018 -2032 (USD Million)
- TABLE 68. UK flavoring agents market estimates & forecast, 2018 -2032 (Kilo Tons) (USD Million)
- TABLE 69. UK flavoring agents market estimates & forecast by application, 2018 -2032 (Kilo Tons)
- TABLE 70. UK flavoring agents market estimates & forecast by application, 2018 -2032 (USD Million)
- TABLE 71. UK flavoring agents market estimates & forecast by type, 2018 -2032 (Kilo Tons)
- TABLE 72. UK flavoring agents market estimates & forecast by type, 2018 -2032 (USD Million)
- TABLE 73. France flavoring agents market estimates & forecast, 2018 -2032 (Kilo Tons) (USD Million)
- TABLE 74. France flavoring agents market estimates & forecast by application, 2018 -2032 (Kilo Tons)
- TABLE 75. France flavoring agents market estimates & forecast by application, 2018 -2032 (USD Million)
- TABLE 76. France flavoring agents market estimates & forecast by type, 2018 -2032 (Kilo Tons)
- TABLE 77. France flavoring agents market estimates & forecast by type, 2018 -2032 (USD Million)
- TABLE 78. Italy flavoring agents market estimates & forecast, 2018 -2032 (Kilo Tons) (USD Million)
- TABLE 79. Italy flavoring agents market estimates & forecast by application, 2018 -2032 (Kilo Tons)
- TABLE 80. Italy flavoring agents market estimates & forecast by application, 2018 -2032 (USD Million)
- TABLE 81. Italy flavoring agents market estimates & forecast by type, 2018 -2032 (Kilo Tons)
- TABLE 82. Italy flavoring agents market estimates & forecast by type, 2018 -2032 (USD Million)
- TABLE 83. Spain flavoring agents market estimates & forecast, 2018 -2032 (Kilo Tons) (USD Million)
- TABLE 84. Spain flavoring agents market estimates & forecast by application, 2018 -2032 (Kilo Tons)
- TABLE 85. Spain flavoring agents market estimates & forecast by application, 2018 -2032 (USD Million)
- TABLE 86. Spain flavoring agents market estimates & forecast by type, 2018 -2032 (Kilo Tons)
- TABLE 87. Spain flavoring agents market estimates & forecast by type, 2018 -2032 (USD Million)
- TABLE 88. Netherlands flavoring agents market estimates & forecast, 2018 -2032 (Kilo Tons) (USD Million)
- TABLE 89. Netherlands flavoring agents market estimates & forecast by application, 2018 -2032 (Kilo Tons)
- TABLE 90. Netherlands flavoring agents market estimates & forecast by application, 2018 -2032 (USD Million)
- TABLE 91. Netherlands flavoring agents market estimates & forecast by type, 2018 -2032 (Kilo Tons)
- TABLE 92. Netherlands flavoring agents market estimates & forecast by type, 2018 -2032 (USD Million)
- TABLE 93. Poland flavoring agents market estimates & forecast, 2018 -2032 (Kilo Tons) (USD Million)
- TABLE 94. Poland flavoring agents market estimates & forecast by application, 2018 -2032 (Kilo Tons)
- TABLE 95. Poland flavoring agents market estimates & forecast by application, 2018 -2032 (USD Million)
- TABLE 96. Poland flavoring agents market estimates & forecast by type, 2018 -2032 (Kilo Tons)
- TABLE 97. Poland flavoring agents market estimates & forecast by type, 2018 -2032 (USD Million)
- TABLE 98. Russia flavoring agents market estimates & forecast, 2018 -2032 (Kilo Tons) (USD Million)
- TABLE 99. Russia flavoring agents market estimates & forecast by application, 2018 -2032 (Kilo Tons)
- TABLE 100. Russia flavoring agents market estimates & forecast by application, 2018 -2032 (USD Million)
- TABLE 101. Russia flavoring agents market estimates & forecast by type, 2018 -2032 (Kilo Tons)
- TABLE 102. Russia flavoring agents market estimates & forecast by type, 2018 -2032 (USD Million)
- TABLE 103. China flavoring agents market estimates & forecast, 2018 -2032 (Kilo Tons) (USD Million)
- TABLE 104. China flavoring agents market estimates & forecast by application, 2018 -2032 (Kilo Tons)
- TABLE 105. China flavoring agents market estimates & forecast by application, 2018 -2032 (USD Million)
- TABLE 106. China flavoring agents market estimates & forecast by type, 2018 -2032 (Kilo Tons)
- TABLE 107. China flavoring agents market estimates & forecast by type, 2018 -2032 (USD Million)
- TABLE 108. India flavoring agents market estimates & forecast, 2018 -2032 (Kilo Tons) (USD Million)
- TABLE 109. India flavoring agents market estimates & forecast by application, 2018 -2032 (Kilo Tons)
- TABLE 110. India flavoring agents market estimates & forecast by application, 2018 -2032 (USD Million)
- TABLE 111. India flavoring agents market estimates & forecast by type, 2018 -2032 (Kilo Tons)
- TABLE 112. India flavoring agents market estimates & forecast by type, 2018 -2032 (USD Million)
- TABLE 113. Japan flavoring agents market estimates & forecast, 2018 -2032 (Kilo Tons) (USD Million)
- TABLE 114. Japan flavoring agents market estimates & forecast by application, 2018 -2032 (Kilo Tons)
- TABLE 115. Japan flavoring agents market estimates & forecast by application, 2018 -2032 (USD Million)
- TABLE 116. Japan flavoring agents market estimates & forecast by type, 2018 -2032 (Kilo Tons)
- TABLE 117. Japan flavoring agents market estimates & forecast by type, 2018 -2032 (USD Million)
- TABLE 118. South Korea flavoring agents market estimates & forecast, 2018 -2032 (Kilo Tons) (USD Million)
- TABLE 119. South Korea flavoring agents market estimates & forecast by application, 2018 -2032 (Kilo Tons)
- TABLE 120. South Korea flavoring agents market estimates & forecast by application, 2018 -2032 (USD Million)
- TABLE 121. South Korea flavoring agents market estimates & forecast by type, 2018 -2032 (Kilo Tons)
- TABLE 122. South Korea flavoring agents market estimates & forecast by type, 2018 -2032 (USD Million)
- TABLE 123. Australia flavoring agents market estimates & forecast, 2018 -2032 (Kilo Tons) (USD Million)
- TABLE 124. Australia flavoring agents market estimates & forecast by application, 2018 -2032 (Kilo Tons)
- TABLE 125. Australia flavoring agents market estimates & forecast by application, 2018 -2032 (USD Million)
- TABLE 126. Australia flavoring agents market estimates & forecast by type, 2018 -2032 (Kilo Tons)
- TABLE 127. Australia flavoring agents market estimates & forecast by type, 2018 -2032 (USD Million)
- TABLE 128. Indonesia flavoring agents market estimates & forecast, 2018 -2032 (Kilo Tons) (USD Million)
- TABLE 129. Indonesia flavoring agents market estimates & forecast by application, 2018 -2032 (Kilo Tons)
- TABLE 130. Indonesia flavoring agents market estimates & forecast by application, 2018 -2032 (USD Million)
- TABLE 131. Indonesia flavoring agents market estimates & forecast by type, 2018 -2032 (Kilo Tons)
- TABLE 132. Indonesia flavoring agents market estimates & forecast by type, 2018 -2032 (USD Million)
- TABLE 133. Thailand flavoring agents market estimates & forecast, 2018 -2032 (Kilo Tons) (USD Million)
- TABLE 134. Thailand flavoring agents market estimates & forecast by application, 2018 -2032 (Kilo Tons)
- TABLE 135. Thailand flavoring agents market estimates & forecast by application, 2018 -2032 (USD Million)
- TABLE 136. Thailand flavoring agents market estimates & forecast by type, 2018 -2032 (Kilo Tons)
- TABLE 137. Thailand flavoring agents market estimates & forecast by type, 2018 -2032 (USD Million)
- TABLE 138. Brazil flavoring agents market estimates & forecast, 2018 -2032 (Kilo Tons) (USD Million)
- TABLE 139. Brazil flavoring agents market estimates & forecast by application, 2018 -2032 (Kilo Tons)
- TABLE 140. Brazil flavoring agents market estimates & forecast by application, 2018 -2032 (USD Million)
- TABLE 141. Brazil flavoring agents market estimates & forecast by type, 2018 -2032 (Kilo Tons)
- TABLE 142. Brazil flavoring agents market estimates & forecast by type, 2018 -2032 (USD Million)
- TABLE 143. Argentina flavoring agents market estimates & forecast, 2018 -2032 (Kilo Tons) (USD Million)
- TABLE 144. Argentina flavoring agents market estimates & forecast by application, 2018 -2032 (Kilo Tons)
- TABLE 145. Argentina flavoring agents market estimates & forecast by application, 2018 -2032 (USD Million)
- TABLE 146. Argentina flavoring agents market estimates & forecast by type, 2018 -2032 (Kilo Tons)
- TABLE 147. Argentina flavoring agents market estimates & forecast by type, 2018 -2032 (USD Million)
- TABLE 148. Mexico flavoring agents market estimates & forecast, 2018 -2032 (Kilo Tons) (USD Million)
- TABLE 149. Mexico flavoring agents market estimates & forecast by application, 2018 -2032 (Kilo Tons)
- TABLE 150. Mexico flavoring agents market estimates & forecast by application, 2018 -2032 (USD Million)
- TABLE 151. Mexico flavoring agents market estimates & forecast by type, 2018 -2032 (Kilo Tons)
- TABLE 152. Mexico flavoring agents market estimates & forecast by type, 2018 -2032 (USD Million)
- TABLE 153. Saudi Arabia flavoring agents market estimates & forecast, 2018 -2032 (Kilo Tons) (USD Million)
- TABLE 154. Saudi Arabia flavoring agents market estimates & forecast by application, 2018 -2032 (Kilo Tons)
- TABLE 155. Saudi Arabia flavoring agents market estimates & forecast by application, 2018 -2032 (USD Million)
- TABLE 156. Saudi Arabia flavoring agents market estimates & forecast by type, 2018 -2032 (Kilo Tons)
- TABLE 157. Saudi Arabia flavoring agents market estimates & forecast by type, 2018 -2032 (USD Million)
- TABLE 158. UAE flavoring agents market estimates & forecast, 2018 -2032 (Kilo Tons) (USD Million)
- TABLE 159. UAE flavoring agents market estimates & forecast by application, 2018 -2032 (Kilo Tons)
- TABLE 160. UAE flavoring agents market estimates & forecast by application, 2018 -2032 (USD Million)
- TABLE 161. UAE flavoring agents market estimates & forecast by type, 2018 -2032 (Kilo Tons)
- TABLE 162. UAE flavoring agents market estimates & forecast by type, 2018 -2032 (USD Million)
- TABLE 163. South Africa flavoring agents market estimates & forecast, 2018 -2032 (Kilo Tons) (USD Million)
- TABLE 164. South Africa flavoring agents market estimates & forecast by application, 2018 -2032 (Kilo Tons)
- TABLE 165. South Africa flavoring agents market estimates & forecast by application, 2018 -2032 (USD Million)
- TABLE 166. South Africa flavoring agents market estimates & forecast by type, 2018 -2032 (Kilo Tons)
- TABLE 167. South Africa flavoring agents market estimates & forecast by type, 2018 -2032 (USD Million)
- TABLE 168. Egypt flavoring agents market estimates & forecast, 2018 -2032 (Kilo Tons) (USD Million)
- TABLE 169. Egypt flavoring agents market estimates & forecast by application, 2018 -2032 (Kilo Tons)
- TABLE 170. Egypt flavoring agents market estimates & forecast by application, 2018 -2032 (USD Million)
- TABLE 171. Egypt flavoring agents market estimates & forecast by type, 2018 -2032 (Kilo Tons)
- TABLE 172. Egypt flavouring agents market estimates & forecast by type, 2018 -2032 (USD Million)
Charts & Figures
- FIG 1. Industry segmentation
- FIG 2. Global flavoring agents market, 2018 -2032 (Kilo Tons) (USD Million)
- FIG 3. Industry ecosystem analysis
- FIG 4. Cost structure analysis, 2022
- FIG 5. Industry impact forces
- FIG 6. Growth potential analysis, 2022
- FIG 7. Market share analysis, 2022
- FIG 8. Porter's analysis
- FIG 9. PESTEL analysis
- FIG 10. Global flavoring agents market share by application, 2022 & 2032
- FIG 11. Global flavoring agents market share by type, 2022 & 2032
- FIG 12. Global flavoring agents market share by region, 2022 & 2032
Global Flavoring Agents Market will witness over 4.5% CAGR between 2023 and 2032, propelled by inventive innovations and extensive research in flavor development. With a focus on taste enhancement, advancements in techniques and ingredients redefine flavor profiles.
For instance, in August 2023, Scholars from Banaras Hindu University formulated a flavor compound derived from coconut coir, boasting potent antioxidant, antimicrobial, and anticancer properties. In their research, the team utilized discarded temple coconut coir as a foundation for fermentative food flavor production. Their study's outcomes have been featured in esteemed journals such as Bioresource Technology, Food Biotechnology, and Applied Food Biotechnology. These findings hold significant promise for the food processing and pharmaceutical sectors, offering substantial benefits and advancements.
From natural extracts to synthetic compounds, these innovations cater to evolving consumer preferences, driving the market's growth. As research delves deeper into taste perception and preferences, the market witnesses a surge in unique and diverse flavoring agents, meeting the demand for novel taste experiences across a wide spectrum of culinary and beverage applications.
The overall Flavoring Agents Market share is classified based on the application, type, and region.
Savory and convenience foods segment will undergo significant development from 2023 to 2032. As consumers prioritize taste and convenience, flavoring agents play a pivotal role in enhancing these food categories. From ready-to-eat meals to snacks, these agents elevate flavors, meeting the demand for diverse taste profiles and culinary experiences. The market adapts, offering innovative flavors tailored for savory dishes and on-the-go options, catering to modern lifestyles where flavorful, convenient food choices are paramount. This trend underscores the integral role of flavoring agents in shaping consumer preferences and market growth.
Flavoring agents market size from the artificial flavors segment will register a noteworthy CAGR from 2023 to 2032. Despite debates around natural versus artificial, the versatility of artificial flavors appeals to manufacturers seeking consistent taste profiles and cost-effective solutions. With advancements in technology mimicking natural flavors, these alternatives cater to various industries, from beverages to processed foods. Their stability and wide application across global cuisines drive their increasing adoption, reflecting the market's reliance on artificial flavors to satisfy consumer cravings for familiar and diverse taste experiences.
Europe flavoring agents industry will showcase a commendable CAGR from 2023 to 2032. Shaped by a rich culinary heritage, European consumers seek diverse and authentic taste experiences. This demand drives the market's growth, spurring innovations in flavoring agents. From traditional to exotic flavors, the market adapts to cater to varied preferences in food and beverages.
As Europe embraces a culture of gastronomy, the market thrives on providing high-quality, nuanced flavor profiles, reflecting the continent's penchant for culinary exploration and sophisticated taste preferences. For instance, in April 2023, Insempra, known for biology-driven innovations, introduced its debut functional ingredient: alpha-Ionone, a natural flavor and fragrance component crafted via biotechnology. Initially created by Phytowelt Green Technologies, this EU-natural certified, vegan, and food-grade ingredient marks Insempra's foray into the food and beauty markets.
Table of Contents
Chapter 1 Methodology & Scope
- 1.1 Methodology
- 1.1.1 Initial data exploration
- 1.1.2 Statistical model and forecast
- 1.1.3 Industry insights and validation
- 1.1.4 Definitions & forecast parameters
- 1.2 Data sources
- 1.2.1 Primary
- 1.2.2 Secondary
Chapter 2 Executive Summary
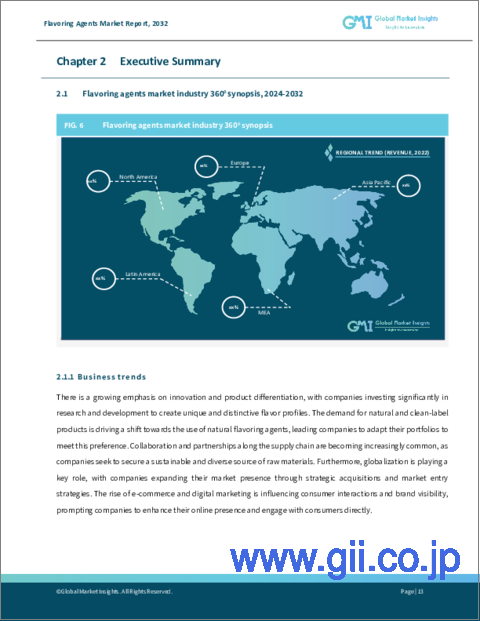
- 2.1 Flavoring agents market 360 degree synopsis, 2018 -2032
- 2.1.1 Business trends
- 2.1.2 Application trends
- 2.1.3 Type trends
- 2.1.4 Regional trends
Chapter 3 Flavoring Agents Industry Insights
- 3.1 Industry segmentation
- 3.2 Industry landscape, 2018 -2032
- 3.3 Industry ecosystem analysis, 2022
- 3.3.1 Raw material suppliers
- 3.3.2 Manufacturers
- 3.3.3 Distribution channel analysis
- 3.3.4 Profit margin analysis
- 3.3.5 Vendor matrix
- 3.4 Technology landscape
- 3.5 Raw material analysis
- 3.6 Global food and beverage industry outlook
- 3.7 Regulatory landscape
- 3.7.1.1 North America
- 3.7.1.2 EU
- 3.7.1.3 APAC
- 3.7.1.4 LATAM
- 3.8 Pricing analysis, 2018 -2032
- 3.8.1 Regional pricing
- 3.8.1.1 North America
- 3.8.1.2 Europe
- 3.8.1.3 APAC
- 3.8.1.4 LATAM
- 3.8.1.5 MEA
- 3.8.2 Cost structure analysis, 2022
- 3.8.1 Regional pricing
- 3.9 Industry impact forces
- 3.9.1 Growth drivers
- 3.9.1.1 North America
- 3.9.1.2 Europe
- 3.9.1.3 APAC
- 3.9.1.4 LATAM
- 3.9.1.5 MEA
- 3.9.2 Industry pitfalls & challenges
- 3.9.1 Growth drivers
- 3.10 Growth potential analysis, 2022
- 3.11 Porter's analysis
- 3.12 Competitive landscape, 2022
- 3.12.1 Company market share analysis, 2022
- 3.12.2 Strategy dashboard
- 3.12.3 Key stakeholders
- 3.13 PESTEL analysis
Chapter 4 Flavoring Agents Market, By Application
- 4.1 Global flavoring agents market share by application, 2022 & 2032
- 4.2 Beverages
- 4.2.1 Market estimates and forecast, 2018 -2032
- 4.2.2 Market estimates and forecast, by region, 2018 -2032
- 4.3 Bakery
- 4.3.1 Market estimates and forecast, 2018 -2032
- 4.3.2 Market estimates and forecast, by region, 2018 -2032
- 4.4 Dairy
- 4.4.1 Market estimates and forecast, 2018 -2032
- 4.4.2 Market estimates and forecast, by region, 2018 -2032
- 4.5 Savory & convenience foods
- 4.5.1 Market estimates and forecast, 2018 -2032
- 4.5.2 Market estimates and forecast, by region, 2018 -2032
- 4.6 Confectionery
- 4.6.1 Market estimates and forecast, 2018 -2032
- 4.6.2 Market estimates and forecast, by region, 2018 -2032
- 4.7 Meat
- 4.7.1 Market estimates and forecast, 2018 -2032
- 4.7.2 Market estimates and forecast, by region, 2018 -2032
- 4.8 Oral Hygiene/ pharmaceutical
- 4.8.1 Market estimates and forecast, 2018 -2032
- 4.8.2 Market estimates and forecast, by region, 2018 -2032
- 4.9 Snacks
- 4.9.1 Market estimates and forecast, 2018 -2032
- 4.9.2 Market estimates and forecast, by region, 2018 -2032
- 4.10 Others (Tobacco, infant food, and animal feed)
- 4.10.1 Market estimates and forecast, 2018 -2032
- 4.10.2 Market estimates and forecast, by region, 2018 -2032
Chapter 5 Flavoring Agents Market, By Type
- 5.1 Global flavoring agents market share by type, 2022 & 2032
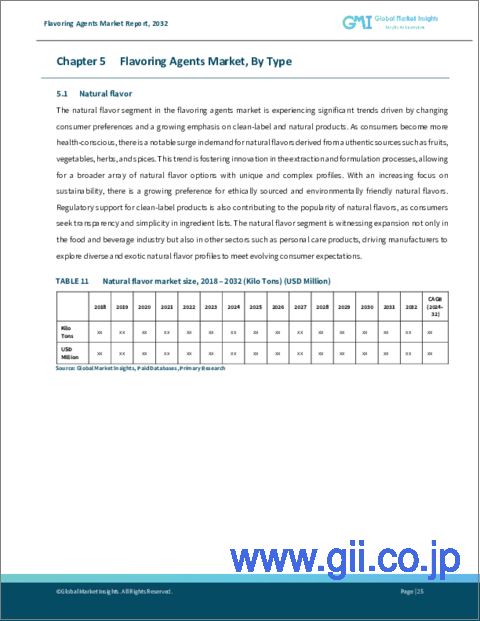
- 5.2 Natural flavors
- 5.2.1 Market estimates and forecast, 2018 -2032
- 5.2.2 Market estimates and forecast, by region, 2018 -2032
- 5.3 Artificial flavors
- 5.3.1 Market estimates and forecast, 2018 -2032
- 5.3.2 Market estimates and forecast, by region, 2018 -2032
Chapter 6 Flavoring Agents Market, By Region
- 6.1 Global flavoring agents market share by region, 2022 & 2032
- 6.2 North America
- 6.2.1 Market estimates and forecast, 2018 -2032
- 6.2.2 Market estimates and forecast, by application, 2018 -2032
- 6.2.3 Market estimates and forecast, by type, 2018 -2032
- 6.2.4 U.S.
- 6.2.4.1 Market estimates and forecast, 2018 -2032
- 6.2.4.2 Market estimates and forecast, by application 2018 -2032
- 6.2.4.3 Market estimates and forecast, by type 2018 -2032
- 6.2.5 Canada
- 6.2.5.1 Market estimates and forecast, 2018 -2032
- 6.2.5.2 Market estimates and forecast, by application 2018 -2032
- 6.2.5.3 Market estimates and forecast, by type 2018 -2032
- 6.3 Europe
- 6.3.1 Market estimates and forecast, 2018 -2032
- 6.3.2 Market estimates and forecast, by application, 2018 -2032
- 6.3.3 Market estimates and forecast, by type, 2018 -2032
- 6.3.4 Germany
- 6.3.4.1 Market estimates and forecast, 2018 -2032
- 6.3.4.2 Market estimates and forecast, by application 2018 -2032
- 6.3.4.3 Market estimates and forecast, by type 2018 -2032
- 6.3.5 UK
- 6.3.5.1 Market estimates and forecast, 2018 -2032
- 6.3.5.2 Market estimates and forecast, by application 2018 -2032
- 6.3.5.3 Market estimates and forecast, by type 2018 -2032
- 6.3.6 France
- 6.3.6.1 Market estimates and forecast, 2018 -2032
- 6.3.6.2 Market estimates and forecast, by application 2018 -2032
- 6.3.6.3 Market estimates and forecast, by type 2018 -2032
- 6.3.7 Italy
- 6.3.7.1 Market estimates and forecast, 2018 -2032
- 6.3.7.2 Market estimates and forecast, by application 2018 -2032
- 6.3.7.3 Market estimates and forecast, by type 2018 -2032
- 6.3.8 Spain
- 6.3.8.1 Market estimates and forecast, 2018 -2032
- 6.3.8.2 Market estimates and forecast, by application 2018 -2032
- 6.3.8.3 Market estimates and forecast, by type 2018 -2032
- 6.3.9 Netherlands
- 6.3.9.1 Market estimates and forecast, 2018 -2032
- 6.3.9.2 Market estimates and forecast, by application 2018 -2032
- 6.3.9.3 Market estimates and forecast, by type 2018 -2032
- 6.3.10 Poland
- 6.3.10.1 Market estimates and forecast, 2018 -2032
- 6.3.10.2 Market estimates and forecast, by application 2018 -2032
- 6.3.10.3 Market estimates and forecast, by type 2018 -2032
- 6.3.11 Russia
- 6.3.11.1 Market estimates and forecast, 2018 -2032
- 6.3.11.2 Market estimates and forecast, by application 2018 -2032
- 6.3.11.3 Market estimates and forecast, by type 2018 -2032
- 6.4 Asia Pacific
- 6.4.1 Market estimates and forecast, 2018 -2032
- 6.4.2 Market estimates and forecast, by application, 2018 -2032
- 6.4.3 Market estimates and forecast, by type, 2018 -2032
- 6.4.4 China
- 6.4.4.1 Market estimates and forecast, 2018 -2032
- 6.4.4.2 Market estimates and forecast, by application 2018 -2032
- 6.4.4.3 Market estimates and forecast, by type 2018 -2032
- 6.4.5 India
- 6.4.5.1 Market estimates and forecast, 2018 -2032
- 6.4.5.2 Market estimates and forecast, by application 2018 -2032
- 6.4.5.3 Market estimates and forecast, by type 2018 -2032
- 6.4.6 Japan
- 6.4.6.1 Market estimates and forecast, 2018 -2032
- 6.4.6.2 Market estimates and forecast, by application 2018 -2032
- 6.4.6.3 Market estimates and forecast, by type 2018 -2032
- 6.4.7 South Korea
- 6.4.7.1 Market estimates and forecast, 2018 -2032
- 6.4.7.2 Market estimates and forecast, by application 2018 -2032
- 6.4.7.3 Market estimates and forecast, by type 2018 -2032
- 6.4.8 Australia
- 6.4.8.1 Market estimates and forecast, 2018 -2032
- 6.4.8.2 Market estimates and forecast, by application 2018 -2032
- 6.4.8.3 Market estimates and forecast, by type 2018 -2032
- 6.4.9 Indonesia
- 6.4.9.1 Market estimates and forecast, 2018 -2032
- 6.4.9.2 Market estimates and forecast, by application 2018 -2032
- 6.4.9.3 Market estimates and forecast, by type 2018 -2032
- 6.4.10 Thailand
- 6.4.10.1 Market estimates and forecast, 2018 -2032
- 6.4.10.2 Market estimates and forecast, by application 2018 -2032
- 6.4.10.3 Market estimates and forecast, by type 2018 -2032
- 6.5 Latin America
- 6.5.1 Market estimates and forecast, 2018 -2032
- 6.5.2 Market estimates and forecast, by application, 2018 -2032
- 6.5.3 Market estimates and forecast, by type, 2018 -2032
- 6.5.4 Brazil
- 6.5.4.1 Market estimates and forecast, 2018 -2032
- 6.5.4.2 Market estimates and forecast, by application 2018 -2032
- 6.5.4.3 Market estimates and forecast, by type 2018 -2032
- 6.5.5 Argentina
- 6.5.5.1 Market estimates and forecast, 2018 -2032
- 6.5.5.2 Market estimates and forecast, by application 2018 -2032
- 6.5.5.3 Market estimates and forecast, by type 2018 -2032
- 6.5.6 Mexico
- 6.5.6.1 Market estimates and forecast, 2018 -2032
- 6.5.6.2 Market estimates and forecast, by application 2018 -2032
- 6.5.6.3 Market estimates and forecast, by type 2018 -2032
- 6.6 Middle East & Africa (MEA)
- 6.6.1 Market estimates and forecast, 2018 -2032
- 6.6.2 Market estimates and forecast, by application, 2018 -2032
- 6.6.3 Market estimates and forecast, by type, 2018 -2032
- 6.6.4 Saudi Arabia
- 6.6.4.1 Market estimates and forecast, 2018 -2032
- 6.6.4.2 Market estimates and forecast, by application 2018 -2032
- 6.6.4.3 Market estimates and forecast, by type 2018 -2032
- 6.6.5 UAE
- 6.6.5.1 Market estimates and forecast, 2018 -2032
- 6.6.5.2 Market estimates and forecast, by application 2018 -2032
- 6.6.5.3 Market estimates and forecast, by type 2018 -2032
- 6.6.6 South Africa
- 6.6.6.1 Market estimates and forecast, 2018 -2032
- 6.6.6.2 Market estimates and forecast, by application 2018 -2032
- 6.6.6.3 Market estimates and forecast, by type 2018 -2032
- 6.6.7 Egypt
- 6.6.7.1 Market estimates and forecast, 2018 -2032
- 6.6.7.2 Market estimates and forecast, by application 2018 -2032
- 6.6.7.3 Market estimates and forecast, by type 2018 -2032
Chapter 7 Company Profiles
- 7.1 Givaudan
- 7.1.1 Business Overview
- 7.1.2 Financial Data
- 7.1.3 Product Landscape
- 7.1.4 Strategic Outlook
- 7.1.5 SWOT Analysis
- 7.2 International Flavors & Fragrances, Inc.
- 7.2.1 Business Overview
- 7.2.2 Financial Data
- 7.2.3 Product Landscape
- 7.2.4 Strategic Outlook
- 7.2.5 SWOT Analysis
- 7.3 Firmenich
- 7.3.1 Business Overview
- 7.3.2 Financial Data
- 7.3.3 Product Landscape
- 7.3.4 Strategic Outlook
- 7.3.5 SWOT Analysis
- 7.4 Symrise AG
- 7.4.1 Business Overview
- 7.4.2 Financial Data
- 7.4.3 Product Landscape
- 7.4.4 Strategic Outlook
- 7.4.5 SWOT Analysis
- 7.5 Mane SA
- 7.5.1 Business Overview
- 7.5.2 Financial Data
- 7.5.3 Product Landscape
- 7.5.4 Strategic Outlook
- 7.5.5 SWOT Analysis
- 7.6 Takasago International Corporation
- 7.6.1 Business Overview
- 7.6.2 Financial Data
- 7.6.3 Product Landscape
- 7.6.4 Strategic Outlook
- 7.6.5 SWOT Analysis
- 7.7 Sensient Flavors
- 7.7.1 Business Overview
- 7.7.2 Financial Data
- 7.7.3 Product Landscape
- 7.7.4 Strategic Outlook
- 7.7.5 SWOT Analysis
- 7.8 Robertet SA
- 7.8.1 Business Overview
- 7.8.2 Financial Data
- 7.8.3 Product Landscape
- 7.8.4 Strategic Outlook
- 7.8.5 SWOT Analysis
- 7.9 T. Hasegawa Co. Ltd.
- 7.9.1 Business Overview
- 7.9.2 Financial Data
- 7.9.3 Product Landscape
- 7.9.4 Strategic Outlook
- 7.9.5 SWOT Analysis
- 7.10 Huabao International Holdings Limited
- 7.10.1 Business Overview
- 7.10.2 Financial Data
- 7.10.3 Product Landscape
- 7.10.4 Strategic Outlook
- 7.10.5 SWOT Analysis
- 7.11 Keva Flavours Private Limited
- 7.11.1 Business Overview
- 7.11.2 Financial Data
- 7.11.3 Product Landscape
- 7.11.4 Strategic Outlook
- 7.11.5 SWOT Analysis
- 7.12 Kerry Group
- 7.12.1 Business Overview
- 7.12.2 Financial Data
- 7.12.3 Product Landscape
- 7.12.4 Strategic Outlook
- 7.12.5 SWOT Analysis
- 7.13 Flavorcan International Inc.
- 7.13.1 Business Overview
- 7.13.2 Financial Data
- 7.13.3 Product Landscape
- 7.13.4 Strategic Outlook
- 7.13.5 SWOT Analysis
