
|
市場調査レポート
商品コード
1667041
遠隔操作車市場の機会、成長促進要因、産業動向分析、2025~2034年の予測Remote Operated Vehicle Market Opportunity, Growth Drivers, Industry Trend Analysis, and Forecast 2025 - 2034 |
||||||
カスタマイズ可能
|
|||||||
| 遠隔操作車市場の機会、成長促進要因、産業動向分析、2025~2034年の予測 |
|
出版日: 2024年12月13日
発行: Global Market Insights Inc.
ページ情報: 英文 120 Pages
納期: 2~3営業日
|

全表示
- 概要
- 目次
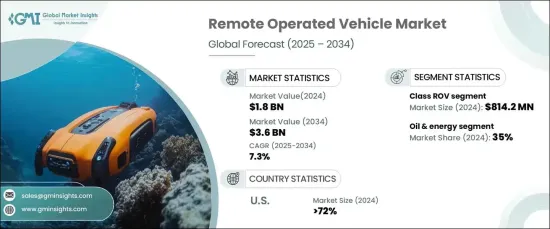
世界の遠隔操作車市場は2024年に18億米ドルと評価され、2025年から2034年にかけてCAGR 7.3%で成長すると予測されています。
様々な産業における自動化需要の高まりが、ROVの台頭を直接後押ししています。これらの乗り物は、石油・ガス、海洋調査、防衛、インフラ検査など、危険な環境や手の届きにくい環境での作業に欠かせません。ROVは、高い精度、一貫性、安全性を必要とする複雑な作業を実行するように設計されており、危険な環境での人間の介入の必要性を最小限に抑えることができます。企業が人件費の削減と安全性の向上を目指す中、信頼性が高く効果的なソリューションとしてROVの採用が加速しています。
さらに、ROVはリアルタイムのデータ収集により作業効率を高め、正確な意思決定とリスク軽減を支援します。このような利点により、さまざまな分野でROVが広く使用されるようになり、今日の自動化された世界におけるROVの重要性が高まっていることが示されています。技術、特に人工知能(AI)とセンサーシステムの進歩は、ROVの能力を大幅に向上させています。AIは、これらの車両がリアルタイムでデータを処理し、画像を認識し、複雑な水中環境を自律的にナビゲートするのに役立ちます。機械学習の統合により、ROVは過去のタスクから学習することで効率を向上させることができ、先進的なセンサーはデータの精度を向上させ、構造モニタリングや海洋生物多様性調査などの高度なアプリケーションにおける役割を拡大しています。
| 市場範囲 | |
|---|---|
| 開始年 | 2024 |
| 予測年 | 2025-2034 |
| 開始金額 | 18億米ドル |
| 予測金額 | 36億米ドル |
| CAGR | 7.3% |
ROVは、遠隔地や水中環境での効率的で一貫した作業のためにますます頼りにされるようになっており、オフショアエネルギー、海洋インフラ、海底採掘などの業界では、点検、保守、修理作業にROVが活用されています。安全性や深度に制限のある人間が操作するシステムとは異なり、ROVは連続稼働が可能なため、ダウンタイムが短縮され、重要な作業が滞りなく実施されます。
市場は成長しているもの、厳しい規制や運用要件などの課題に直面しています。企業は、海洋活動、環境保護、安全に関するさまざまな地域的・国際的規制に準拠しなければならず、安全対策やコンプライアンス手順への多額の投資が必要となります。特に石油・ガス分野では、環境破壊を防止し、ROV操作中の安全を確保するための厳しい規制が適用されます。
市場は、作業クラスROV、軽作業クラスROV、観測クラスROV、マイクロ/ミニROVなど、いくつかのROVタイプに分けられます。2024年現在、作業クラスROVセグメントの市場規模は8億1,420万米ドルでした。自動化とAIの統合が作業クラスROVを変革し、反復作業を自律的に処理できるようにすることで、作業効率を高めています。
用途別では、石油・エネルギー分野が2024年の市場シェアの35%を占めています。ROVはオフショア石油・ガス産業における海底作業に不可欠であり、パイプラインやその他の海底インフラの設置、検査、メンテナンスなどの重要な作業を行っています。定格深度や積載量など、ROV技術の継続的な向上により、深海探査におけるROVの役割は確実に高めています。
米国では、ROVは2024年の総市場収益の72%を占めています。オフショア石油・ガス産業における需要がこの成長の主な原動力であり、ROVは深海作業において重要な役割を果たしています。さらに、オフショア風力エネルギー分野の拡大が、この地域でのROV採用をさらに後押ししています。
目次
第1章 調査手法と調査範囲
- 調査デザイン
- 調査アプローチ
- データ収集方法
- 基本推定と計算
- 基準年の算出
- 市場推計の主要動向
- 予測モデル
- 1次調査と検証
- 一次情報
- データマイニングソース
- 市場定義
第2章 エグゼクティブサマリー
第3章 業界洞察
- エコシステム分析
- サプライヤーの状況
- 原材料サプライヤー
- 部品サプライヤー
- メーカー
- サービス・プロバイダー
- 販売業者
- 最終用途
- 利益率分析
- コスト内訳分析
- テクノロジーとイノベーションの展望
- 主要ニュースと取り組み
- 規制状況
- 影響要因
- 促進要因
- 全産業における自動化の進展
- テクノロジーとAIの革新
- 効率的な配送ソリューションへの需要
- 持続可能性への取り組みと環境への関心の高まり
- 業界の潜在的リスク&課題
- 課題と規制のハードル
- 高いメンテナンスコスト
- 促進要因
- 成長可能性分析
- ポーターの分析
- PESTEL分析
第4章 競合情勢
- イントロダクション
- 企業シェア分析
- 競合のポジショニング・マトリックス
- 戦略展望マトリックス
第5章 市場推計・予測:クラス別、2021年~2034年
- 主要動向
- 作業クラスROV
- 軽作業クラスROV
- 観測クラスROV
- マイクロ/ミニROV
第6章 市場推計・予測:用途別、2021年~2034年
- 主要動向
- 水産養殖
- 商業・サルベージダイビング
- 自治体インフラ
- 軍事
- 石油・エネルギー
- その他
第7章 市場推計・予測:地域別、2021年~2034年
- 主要動向
- 北米
- 米国
- カナダ
- 欧州
- 英国
- ドイツ
- フランス
- イタリア
- スペイン
- ロシア
- オランダ
- 北欧
- アジア太平洋
- 中国
- インド
- 日本
- 韓国
- オーストラリア
- 東南アジア
- ラテンアメリカ
- ブラジル
- アルゼンチン
- メキシコ
- 中東・アフリカ
- UAE
- サウジアラビア
- 南アフリカ
第8章 企業プロファイル
- AC-CESS Co UK Ltd
- Deep Ocean Group
- DOF Subsea
- Forum Energy Technologies
- Fugro
- i-Tech 7
- Kongsberg Maritime
- Oceaneering International
- ROVOP
- Saab Seaeye
- SEAMOR
- Seatronics
- Subsea 7
- TechnipFMC
- VideoRay
The Global Remote Operated Vehicle Market was valued at USD 1.8 billion in 2024 and is projected to grow at a CAGR of 7.3% from 2025 to 2034. The increasing demand for automation in various industries is directly fueling the rise of ROVs. These vehicles are crucial for tasks in hazardous or hard-to-reach environments, such as those found in oil and gas, marine research, defense, and infrastructure inspection. ROVs are designed to carry out complex operations that require high precision, consistency, and safety, minimizing the need for human intervention in dangerous settings. With companies aiming to reduce labor costs and enhance safety, the adoption of ROVs is accelerating as a reliable and effective solution.
Furthermore, ROVs offer operational efficiency by providing real-time data collection, which aids in accurate decision-making and risk mitigation. These benefits are driving the widespread use of ROVs across diverse sectors, showcasing their growing importance in today's automated world. The advancement of technology, particularly artificial intelligence (AI) and sensor systems, is significantly enhancing ROV capabilities. AI helps these vehicles process data in real-time, recognize images, and autonomously navigate complex underwater environments. The integration of machine learning allows ROVs to improve efficiency through learning from past tasks, while advanced sensors offer improved data accuracy, expanding their role in sophisticated applications such as structural monitoring and marine biodiversity studies.
| Market Scope | |
|---|---|
| Start Year | 2024 |
| Forecast Year | 2025-2034 |
| Start Value | $1.8 Billion |
| Forecast Value | $3.6 Billion |
| CAGR | 7.3% |
ROVs are increasingly relied upon for efficient and consistent operations in remote or underwater environments, with industries like offshore energy, marine infrastructure, and underwater mining depending on them for inspection, maintenance, and repair tasks. Unlike human-operated systems that are limited by safety and depth, ROVs can operate continuously, reducing downtime and ensuring critical operations are carried out without delay.
Despite their growth, the market faces challenges, including stringent regulatory and operational requirements. Companies must comply with various regional and international regulations regarding marine activities, environmental protection, and safety, which require significant investments in safety measures and compliance procedures. The oil and gas sector, in particular, is subject to strict regulations to prevent environmental damage and ensure safety during ROV operations.
The market is divided into several ROV types, including work-class ROVs, light work-class ROVs, observation-class ROVs, and micro/mini ROVs. As of 2024, the work-class ROV segment was valued at USD 814.2 million. Automation and AI integration are transforming the work-class ROVs, enabling them to handle repetitive tasks autonomously, thereby enhancing operational efficiency.
In terms of application, the oil and energy sector accounted for 35% of the market share in 2024. ROVs are indispensable for subsea operations in the offshore oil and gas industry, performing critical tasks like installation, inspection, and maintenance of pipelines and other subsea infrastructure. The continuous improvement of ROV technology, including depth ratings and payload capacity, ensures their growing role in deepwater exploration.
In the U.S., ROVs accounted for 72% of the total market revenue in 2024. The demand in the offshore oil and gas industry is a key driver of this growth, with ROVs playing a vital role in deepwater operations. Additionally, the expanding offshore wind energy sector further boosts ROV adoption in the region.
Table of Contents
Chapter 1 Methodology & Scope
- 1.1 Research design
- 1.1.1 Research approach
- 1.1.2 Data collection methods
- 1.2 Base estimates and calculations
- 1.2.1 Base year calculation
- 1.2.2 Key trends for market estimates
- 1.3 Forecast model
- 1.4 Primary research & validation
- 1.4.1 Primary sources
- 1.4.2 Data mining sources
- 1.5 Market definitions
Chapter 2 Executive Summary
- 2.1 Industry 3600 synopsis, 2021 - 2034
Chapter 3 Industry Insights
- 3.1 Industry ecosystem analysis
- 3.2 Supplier landscape
- 3.2.1 Raw material supplier
- 3.2.2 Component supplier
- 3.2.3 Manufacturer
- 3.2.4 Service provider
- 3.2.5 Distributor
- 3.2.6 End use
- 3.3 Profit margin analysis
- 3.4 Cost breakdown analysis
- 3.5 Technology & innovation landscape
- 3.6 Key news & initiatives
- 3.7 Regulatory landscape
- 3.8 Impact forces
- 3.8.1 Growth drivers
- 3.8.1.1 Rise in automation across industries
- 3.8.1.2 Innovation in technology and AI
- 3.8.1.3 Demand for efficient delivery solution
- 3.8.1.4 Growing sustainability initiatives and environmental concerns
- 3.8.2 Industry pitfalls & challenges
- 3.8.2.1 Challenges and regulatory hurdles
- 3.8.2.2 High cost of maintenance
- 3.8.1 Growth drivers
- 3.9 Growth potential analysis
- 3.10 Porter’s analysis
- 3.11 PESTEL analysis
Chapter 4 Competitive Landscape, 2024
- 4.1 Introduction
- 4.2 Company market share analysis
- 4.3 Competitive positioning matrix
- 4.4 Strategic outlook matrix
Chapter 5 Market Estimates & Forecast, By Class , 2021 - 2034 ($Mn, Units)
- 5.1 Key trends
- 5.2 Work class ROV
- 5.3 Light work class ROV
- 5.4 Observation class ROV
- 5.5 Micro/mini ROV
Chapter 6 Market Estimates & Forecast, By Application, 2021 - 2034 ($Mn, Units)
- 6.1 Key trends
- 6.2 Aquaculture
- 6.3 Commercial & salvage diving
- 6.4 Municipal infrastructure
- 6.5 Military
- 6.6 Oil & energy
- 6.7 Others
Chapter 7 Market Estimates & Forecast, By Region, 2021 - 2034 ($Mn, Units)
- 7.1 Key trends
- 7.2 North America
- 7.2.1 U.S.
- 7.2.2 Canada
- 7.3 Europe
- 7.3.1 UK
- 7.3.2 Germany
- 7.3.3 France
- 7.3.4 Italy
- 7.3.5 Spain
- 7.3.6 Russia
- 7.3.7 Netherlands
- 7.3.8 Nordics
- 7.4 Asia Pacific
- 7.4.1 China
- 7.4.2 India
- 7.4.3 Japan
- 7.4.4 South Korea
- 7.4.5 Australia
- 7.4.6 Southeast Asia
- 7.5 Latin America
- 7.5.1 Brazil
- 7.5.2 Argentina
- 7.5.3 Mexico
- 7.6 MEA
- 7.6.1 UAE
- 7.6.2 Saudi Arabia
- 7.6.3 South Africa
Chapter 8 Company Profiles
- 8.1 AC-CESS Co UK Ltd
- 8.2 Deep Ocean Group
- 8.3 DOF Subsea
- 8.4 Forum Energy Technologies
- 8.5 Fugro
- 8.6 i-Tech 7
- 8.7 Kongsberg Maritime
- 8.8 Oceaneering International
- 8.9 ROVOP
- 8.10 Saab Seaeye
- 8.11 SEAMOR
- 8.12 Seatronics
- 8.13 Subsea 7
- 8.14 TechnipFMC
- 8.15 VideoRay

