
|
市場調査レポート
商品コード
1666671
Web 3.0ブロックチェーン市場の機会、成長促進要因、産業動向分析、2025年~2034年の予測Web 3.0 Blockchain Market Opportunity, Growth Drivers, Industry Trend Analysis, and Forecast 2025 - 2034 |
||||||
カスタマイズ可能
|
|||||||
| Web 3.0ブロックチェーン市場の機会、成長促進要因、産業動向分析、2025年~2034年の予測 |
|
出版日: 2024年12月03日
発行: Global Market Insights Inc.
ページ情報: 英文 175 Pages
納期: 2~3営業日
|

全表示
- 概要
- 目次
世界のWeb 3.0ブロックチェーン市場は、2024年に28億米ドルと評価され、2025年から2034年までのCAGRは33.5%と予測され、著しい成長を遂げる見込みです。
この急成長の背景には、分散型アプリケーション(dApps)の普及に加え、データのプライバシーやセキュリティに対する懸念の高まりがあります。仲介者を排除するこれらのアプリケーションは、透明性と安全性を高めると同時に、ユーザーが自分のデータをコントロールできるようにします。このような非中央集権化に向けた変革は、デジタルの展望を再定義し、ブロックチェーンを不可欠な技術として確固たるものにしつつあります。
Web 3.0ブロックチェーン市場は、パブリック、プライベート、コンソーシアム、ハイブリッドのブロックチェーンタイプに分類されます。2024年には、パブリック・ブロックチェーン・セグメントが圧倒的な60%のシェアで市場をリードし、2034年には250億米ドルに急増すると予測されています。パブリック・ブロックチェーンは、その比類のない透明性により、安全で改ざん防止され、オープンにアクセス可能な取引台帳を提供することから、ますます支持されるようになっています。このオープン性は信頼を育み、説明責任を確実にするため、パブリック・ブロックチェーンは分散型ウェブ3.0のエコシステムに不可欠なものとなっています。
| 市場範囲 | |
|---|---|
| 開始年 | 2024 |
| 予測年 | 2025-2034 |
| 開始金額 | 28億米ドル |
| 予測金額 | 488億米ドル |
| CAGR | 33.5% |
最終用途別に、市場は企業、政府・公共機関、個人ユーザーに区分されます。2024年は企業セグメントが圧倒的で、市場シェアの63%を占めています。企業はブロックチェーンを活用して業務の合理化、効率化、コスト削減を図っています。スマートコントラクトの利用により、企業はサプライチェーン管理やクロスボーダー取引などの重要なプロセスを自動化し、エラーや運用コストを最小限に抑えることができます。さらに、ブロックチェーンの不変的な性質はデータの完全性を保証し、不正リスクを軽減し、ビジネスネットワーク全体の信頼を醸成します。主な使用事例としては、安全なID管理、透明性の高い監査、知的財産の保護などがあり、これらは今日のデジタル経済において極めて重要です。
北米のWeb 3.0ブロックチェーン市場は2024年に世界シェアの35%を占めたが、これは同地域の技術イノベーター、新興企業、大規模なベンチャーキャピタル投資によるエコシステムの繁栄が原動力となっています。このような技術的リーダーシップにより、複数のセクター、特に金融機関においてブロックチェーンの導入が加速しており、金融機関では決済システムの強化、分散型金融(DeFi)ソリューション、デジタル資産管理などにこの技術を活用しています。
目次
第1章 調査手法と調査範囲
- 調査デザイン
- 調査アプローチ
- データ収集方法
- 基本推定と計算
- 基準年の算出
- 市場推計の主要動向
- 予測モデル
- 1次調査と検証
- 一次情報
- データマイニングソース
- 市場範囲と定義
第2章 エグゼクティブサマリー
第3章 業界洞察
- エコシステム分析
- ブロックチェーンプラットフォームプロバイダー
- 分散型アプリ開発者
- 最終用途
- サプライヤーの状況
- 利益率分析
- テクノロジー&イノベーション・情勢
- 特許分析
- 主要ニュースと取り組み
- 規制状況
- メタバース開発におけるウェブ3.0の役割
- 新たなアプリケーションと使用事例
- 影響要因
- 促進要因
- ウェブ3.0アプリケーションにおける資金調達の増加
- 改ざん防止台帳に対する需要の高まり
- 非中央集権的で信頼性の高いシステムに対する需要の高まり
- 分散型金融アプリケーションの増加
- 業界の潜在的リスク&課題
- 非代替性トークン(NFT)の人気の高まり
- 広範囲にわたる規制の不確実性
- 促進要因
- 成長可能性分析
- ポーターの分析
- PESTEL分析
第4章 競合情勢
- イントロダクション
- 企業シェア分析
- 競合のポジショニング・マトリックス
- 戦略展望マトリックス
第5章 市場推計・予測:ブロックチェーン別、2021年~2034年
- 主要動向
- パブリック
- プライベート
- コンソーシアム
- ハイブリッド
第6章 市場推計・予測:アプリケーション別、2021年~2034年
- 主要動向
- 暗号通貨
- 会話型AI
- データ&トランザクション・ストレージ
- 決済
- スマートコントラクト
- デジタル・アイデンティティ
- ガバナンス
- その他
第7章 市場推計・予測:最終用途別、2021年~2034年
- 主要動向
- 個人
- 企業
- 官公庁
第8章 市場推計・予測:産業別、2021年~2034年
- 主要動向
- BFSI
- 小売・eコマース
- メディア&エンターテインメント
- ヘルスケア
- 不動産
- IT &テレコム
- その他
第9章 市場推計・予測:地域別、2021年~2034年
- 主要動向
- 北米
- 米国
- カナダ
- 欧州
- 英国
- ドイツ
- フランス
- イタリア
- スペイン
- ロシア
- 北欧
- アジア太平洋
- 中国
- インド
- 日本
- オーストラリア
- 韓国
- 東南アジア
- ラテンアメリカ
- ブラジル
- メキシコ
- アルゼンチン
- 中東・アフリカ
- UAE
- 南アフリカ
- サウジアラビア
第10章 企業プロファイル
- Alchemy
- Aptos
- Autograph
- Binance
- Chainlink
- Coinbase
- CoinList
- Consensys
- Decentraland
- Filecoin
- Helium
- Immutable X
- Kadena
- Livepeer
- Ocean Protocol
- OpenSea
- Polkadot
- Polygon
- Terra
- The Sandbox
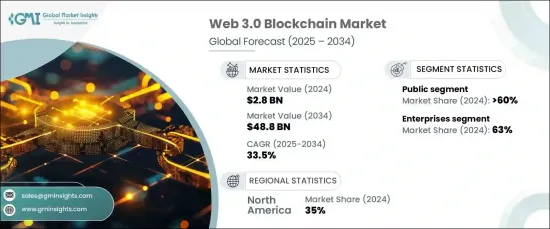
The Global Web 3.0 Blockchain Market, valued at USD 2.8 billion in 2024, is set to experience remarkable growth, with a projected CAGR of 33.5% from 2025 to 2034. This surge is fueled by escalating concerns about data privacy and security, alongside the widespread adoption of decentralized applications (dApps). These applications, which eliminate intermediaries, empower users with enhanced control over their data while boosting transparency and security. This transformative shift toward decentralization is redefining the digital landscape, solidifying blockchain as an essential technology.
The Web 3.0 blockchain market is categorized into public, private, consortium, and hybrid blockchain types. In 2024, the public blockchain segment led the market with a commanding 60% share and is projected to skyrocket to $25 billion by 2034. Public blockchains are increasingly favored for their unparalleled transparency, offering a secure, tamper-proof, and openly accessible ledger of transactions. This openness fosters trust and ensures accountability, making public blockchains indispensable to the decentralized Web 3.0 ecosystem.
| Market Scope | |
|---|---|
| Start Year | 2024 |
| Forecast Year | 2025-2034 |
| Start Value | $2.8 Billion |
| Forecast Value | $48.8 Billion |
| CAGR | 33.5% |
By end use, the market is segmented into enterprises, government and public sector, and individual users. The enterprise segment dominated in 2024, capturing 63% of the market share. Enterprises are leveraging blockchain to streamline operations, enhance efficiency, and reduce costs. Through the use of smart contracts, businesses can automate critical processes like supply chain management and cross-border transactions, minimizing errors and operational expenses. Additionally, blockchain's immutable nature ensures data integrity, mitigating fraud risks and fostering trust across business networks. Key use cases include secure identity management, transparent audits, and intellectual property protection-crucial in today's digital economy.
North America Web 3.0 blockchain market accounted for 35% of the global share in 2024, driven by the region's thriving ecosystem of tech innovators, startups, and significant venture capital investments. This technological leadership accelerates blockchain adoption across multiple sectors, particularly finance, where institutions are leveraging the technology for enhanced payment systems, decentralized finance (DeFi) solutions, and digital asset management.
Table of Contents
Chapter 1 Methodology & Scope
- 1.1 Research design
- 1.1.1 Research approach
- 1.1.2 Data collection methods
- 1.2 Base estimates & calculations
- 1.2.1 Base year calculation
- 1.2.2 Key trends for market estimation
- 1.3 Forecast model
- 1.4 Primary research and validation
- 1.4.1 Primary sources
- 1.4.2 Data mining sources
- 1.5 Market scope & definition
Chapter 2 Executive Summary
- 2.1 Industry 3600 synopsis, 2021 - 2034
Chapter 3 Industry Insights
- 3.1 Industry ecosystem analysis
- 3.1.1 Blockchain platform providers
- 3.1.2 Decentralized app developers
- 3.1.3 End use
- 3.2 Supplier landscape
- 3.3 Profit margin analysis
- 3.4 Technology & innovation landscape
- 3.5 Patent analysis
- 3.6 Key news & initiatives
- 3.7 Regulatory landscape
- 3.8 The role of web 3.0 in metaverse development
- 3.9 Emerging applications and use cases
- 3.10 Impact forces
- 3.10.1 Growth drivers
- 3.10.1.1 Increasing funding in Web 3.0 applications
- 3.10.1.2 Rising demand for tamper-proof ledgers
- 3.10.1.3 Growing demand for decentralized and trustless systems
- 3.10.1.4 Rising decentralized finance applications
- 3.10.2 Industry pitfalls & challenges
- 3.10.2.1 Increasing popularity of Non-Fungible Tokens (NFTs)
- 3.10.2.2 Extensive regulatory uncertainty
- 3.10.1 Growth drivers
- 3.11 Growth potential analysis
- 3.12 Porter’s analysis
- 3.13 PESTEL analysis
Chapter 4 Competitive Landscape, 2024
- 4.1 Introduction
- 4.2 Company market share analysis
- 4.3 Competitive positioning matrix
- 4.4 Strategic outlook matrix
Chapter 5 Market Estimates & Forecast, By Blockchain, 2021 - 2034 ($Bn)
- 5.1 Key trends
- 5.2 Public
- 5.3 Private
- 5.4 Consortium
- 5.5 Hybrid
Chapter 6 Market Estimates & Forecast, By Application, 2021 - 2034 ($Bn)
- 6.1 Key trends
- 6.2 Cryptocurrency
- 6.3 Conversational AI
- 6.4 Data & transaction storage
- 6.5 Payments
- 6.6 Smart contracts
- 6.7 Digital identity
- 6.8 Governance
- 6.9 Others
Chapter 7 Market Estimates & Forecast, By End Use, 2021 - 2034 ($Bn)
- 7.1 Key trends
- 7.2 Individual
- 7.3 Enterprises
- 7.4 Government & public sector
Chapter 8 Market Estimates & Forecast, By Industry Vertical, 2021 - 2034 ($Bn)
- 8.1 Key trends
- 8.2 BFSI
- 8.3 Retail & e-commerce
- 8.4 Media & entertainment
- 8.5 Healthcare
- 8.6 Real estate
- 8.7 IT & telecom
- 8.8 Others
Chapter 9 Market Estimates & Forecast, By Region, 2021 - 2034 ($Bn)
- 9.1 Key trends
- 9.2 North America
- 9.2.1 U.S.
- 9.2.2 Canada
- 9.3 Europe
- 9.3.1 UK
- 9.3.2 Germany
- 9.3.3 France
- 9.3.4 Italy
- 9.3.5 Spain
- 9.3.6 Russia
- 9.3.7 Nordics
- 9.4 Asia Pacific
- 9.4.1 China
- 9.4.2 India
- 9.4.3 Japan
- 9.4.4 Australia
- 9.4.5 South Korea
- 9.4.6 Southeast Asia
- 9.5 Latin America
- 9.5.1 Brazil
- 9.5.2 Mexico
- 9.5.3 Argentina
- 9.6 MEA
- 9.6.1 UAE
- 9.6.2 South Africa
- 9.6.3 Saudi Arabia
Chapter 10 Company Profiles
- 10.1 Alchemy
- 10.2 Aptos
- 10.3 Autograph
- 10.4 Binance
- 10.5 Chainlink
- 10.6 Coinbase
- 10.7 CoinList
- 10.8 Consensys
- 10.9 Decentraland
- 10.10 Filecoin
- 10.11 Helium
- 10.12 Immutable X
- 10.13 Kadena
- 10.14 Livepeer
- 10.15 Ocean Protocol
- 10.16 OpenSea
- 10.17 Polkadot
- 10.18 Polygon
- 10.19 Terra
- 10.20 The Sandbox
