|
|
市場調査レポート
商品コード
1628187
自律型AI・自律型エージェントの市場機会、成長促進要因、産業動向分析、2025年~2034年予測Autonomous AI and Autonomous Agents Market Opportunity, Growth Drivers, Industry Trend Analysis, and Forecast 2025 to 2034 |
||||||
|
|||||||
カスタマイズ可能
|
|||||||

| 自律型AI・自律型エージェントの市場機会、成長促進要因、産業動向分析、2025年~2034年予測 |
|
出版日: 2024年11月27日
発行: Global Market Insights Inc.
ページ情報: 英文 175 Pages
納期: 2~3営業日
|

全表示
- 概要
- 目次
世界の自律型AI・自律型エージェント市場は、2024年に68億米ドルの規模に達し、2025年から2034年までのCAGRは30.3%になると予測されています。
この急成長の背景には、世界中の企業でAI技術が広く採用されていることがあります。顧客サービスにおけるチャットボットから高度なデータ分析まで、企業はますますAIを活用して効率を高め、意思決定を改善し、イノベーションを促進し、市場拡大に貢献しています。
世界各国の政府は、公共サービスの向上、インフラの近代化、デジタルトランスフォーメーションの支援のため、AIに多額の投資を行っています。こうした公共部門の投資は民間企業の努力を補完するものであり、民間企業も競争力を維持するためにAIの研究開発に資源を投入しています。その結果、防衛、ヘルスケア、スマートシティなどの業界は、自律型AIシステムの開発・展開の加速による恩恵を受けています。
市場はオンプレミスとクラウドの導入モデルに分類されます。2024年には、クラウドベースのソリューションが市場シェアの65%以上を占め、2034年には900億米ドルを超えると予想されています。クラウド展開により、企業は大規模なデータセットを効率的に管理し、必要に応じて業務を拡張することができます。これは、ヘルスケア、金融、小売など、AIの迅速な導入が重要な分野で特に価値が高いです。クラウドを活用することで、企業はITインフラへの多額の先行投資を回避することができ、AIソリューションのより容易でコスト効率の高い展開が可能になります。
| 市場範囲 | |
|---|---|
| 開始年 | 2024年 |
| 予測年 | 2025年~2034年 |
| 開始金額 | 68億米ドル |
| 予測金額 | 937億米ドル |
| CAGR | 30.3% |
新興企業や中小企業にとって、クラウドベースのAIプラットフォームは、大規模なリソースを必要とせずに先進技術を導入できるコスト効率の高い方法を提供します。この柔軟性が、予測期間を通じてクラウド・セグメントの大幅な成長を促進すると予想されます。
産業別に見ると、自律型AI・エージェント市場は、小売、金融、IT・通信、製造、ヘルスケア、防衛、自動車、エネルギーなど、さまざまな分野に及んでいます。例えば、金融・銀行・保険(BFSI)分野では、AIを搭載したチャットボットやバーチャルアシスタントを利用して、パーソナライズされた金融アドバイスの提供、問い合わせへの対応、定型業務の処理など、顧客サービス業務の自動化が進んでいます。これにより、顧客満足度を高めつつ、運用コストを削減することができます。
さらに、BFSIセクターのAIエージェントは、不正検知、マネーロンダリング対策、リスク管理において重要な役割を果たしています。大規模なデータセットをリアルタイムで分析することで、これらのシステムは異常なパターンを検出し、潜在的なセキュリティ脅威に警告を発し、コンプライアンス・プロセスを合理化することができ、これらすべてが業務効率化に貢献します。
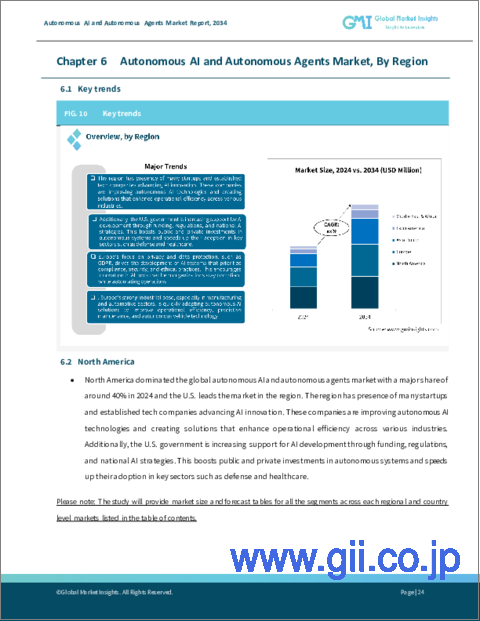
北米は自律型AI・エージェント市場で圧倒的なシェアを占めており、2024年の売上高の40%を占めています。この地域には、AIイノベーションを主導する数多くのハイテク新興企業や既存企業が存在します。また、米国政府は資金提供、戦略的規制、国家的AIイニシアティブを通じてAI開発を積極的に支援しており、これが防衛やヘルスケアなどの業界全体で自律型AI技術の採用をさらに加速させています。
目次
第1章 調査手法と調査範囲
第2章 エグゼクティブサマリー
第3章 業界洞察
- 業界エコシステム分析
- ハードウェアプロバイダー
- ソフトウェアプロバイダー
- クラウドサービスプロバイダー
- システムインテグレーター
- エンドユーザー
- サプライヤーの状況
- 利益率分析
- テクノロジー・イノベーション・情勢
- 特許分析
- 主要ニュース・イニシアチブ
- 規制状況
- AIへの政府投資:地域別
- 消費者とエンドユーザーの洞察
- 影響要因
- 成長促進要因
- 自動化と効率化に対する世界の需要の高まり
- AIと機械学習(ML)技術の進歩の高まり
- クラウドコンピューティングの採用増加
- 製造分野における自律型AIと自律型エージェントの需要の高まり
- 業界の潜在的リスク・課題
- AI研究開発に対する政府支援の急増
- 安全性と信頼性への懸念
- 成長促進要因
- 成長可能性分析
- ポーター分析
- PESTEL分析
第4章 競合情勢
- イントロダクション
- 企業市場シェア分析
- 競合のポジショニング・マトリックス
- 戦略展望マトリックス
第5章 市場推計・予測:コンポーネント別、2021年~2034年
- 主要動向
- ハードウェア
- ソフトウェア
- サービス
第6章 市場推計・予測:展開モデル別、2021年~2034年
- 主要動向
- オンプレミス
- クラウド
第7章 市場推計・予測:企業規模別、2021年~2034年
- 主要動向
- 大企業
- 中小企業
第8章 市場推計・予測:技術別、2021年~2034年
- 主要動向
- 機械学習
- 自然言語処理
- コンテキスト認識
- コンピュータビジョン
第9章 市場推計・予測:業界別、2021年~2034年
- 主要動向
- 小売・eコマース
- BFSI
- IT・通信
- 製造業
- ヘルスケア・ライフサイエンス
- 政府・防衛
- 自動車
- エネルギー・電力
- その他
第10章 市場推計・予測:地域別、2021年~2034年
- 主要動向
- 北米
- 米国
- カナダ
- 欧州
- 英国
- ドイツ
- フランス
- イタリア
- スペイン
- ロシア
- 北欧
- アジア太平洋
- 中国
- インド
- 日本
- オーストラリア
- 韓国
- 東南アジア
- ラテンアメリカ
- ブラジル
- メキシコ
- アルゼンチン
- 中東・アフリカ
- UAE
- 南アフリカ
- サウジアラビア
第11章 企業プロファイル
- Aerogility
- AgentGPT
- AWS
- Baidu
- C3.ai
- Deepmind
- Fetch.ai
- Genesys
- H20.ai
- IBM
- Microsoft
- Nvidia Corporation
- OpenAI
- Oracle
- Rezolve AI Limited
- Salesforce
- SAP SE
- SAS Institute
The Global Autonomous AI And Autonomous Agents Market reached a value of USD 6.8 billion in 2024 and is estimated to exhibit a CAGR of 30.3% expected from 2025 to 2034. This rapid growth is driven by the widespread adoption of AI technologies by businesses worldwide. From chatbots in customer service to advanced data analytics, companies are increasingly using AI to boost efficiency, improve decision-making, and foster innovation, contributing to market expansion.
Governments globally are investing heavily in AI to improve public services, modernize infrastructure, and support digital transformation. This public sector investment complements the efforts of private enterprises, which are also pouring resources into AI research and development to maintain their competitive edge. As a result, industries such as defense, healthcare, and smart cities benefit from the accelerated development and deployment of autonomous AI systems.
The market is categorized into on-premises and cloud deployment models. In 2024, cloud-based solutions accounted for more than 65% of the market share and are expected to exceed USD 90 billion by 2034. Cloud deployment allows businesses to efficiently manage large data sets and scale operations as required. This is particularly valuable in sectors like healthcare, finance, and retail, where rapid AI adoption is crucial. By utilizing the cloud, companies can avoid significant upfront investments in IT infrastructure, enabling easier and more cost-effective deployment of AI solutions.
| Market Scope | |
|---|---|
| Start Year | 2024 |
| Forecast Year | 2025-2034 |
| Start Value | $6.8 Billion |
| Forecast Value | $93.7 Billion |
| CAGR | 30.3% |
For startups and small businesses, cloud-based AI platforms offer a cost-effective way to adopt advanced technologies without the need for extensive resources. This flexibility is expected to drive substantial growth in the cloud segment throughout the forecast period.
Industry-wise, the autonomous AI and agents market spans various sectors, including retail, finance, IT and telecom, manufacturing, healthcare, defense, automotive, and energy. The finance, banking, and insurance (BFSI) sector, for example, is increasingly automating customer service operations, using AI-powered chatbots and virtual assistants to deliver personalized financial advice, respond to inquiries, and handle routine tasks. This reduces operational costs while enhancing customer satisfaction.
Furthermore, AI agents in the BFSI sector are playing a critical role in fraud detection, anti-money laundering efforts, and risk management. By analyzing large data sets in real-time, these systems can detect unusual patterns, flag potential security threats, and streamline compliance processes, all of which contribute to operational efficiency.
North America holds a dominant share of the autonomous AI and agents market, accounting for 40% of the revenue in 2024. The region is home to numerous tech startups and established companies leading the charge in AI innovation. The U.S. government is also actively supporting AI development through funding, strategic regulations, and national AI initiatives, which further accelerates the adoption of autonomous AI technologies across industries like defense and healthcare.
Table of Contents
Chapter 1 Methodology & Scope
- 1.1 Research design
- 1.1.1 Research approach
- 1.1.2 Data collection methods
- 1.2 Base estimates & calculations
- 1.2.1 Base year calculation
- 1.2.2 Key trends for market estimation
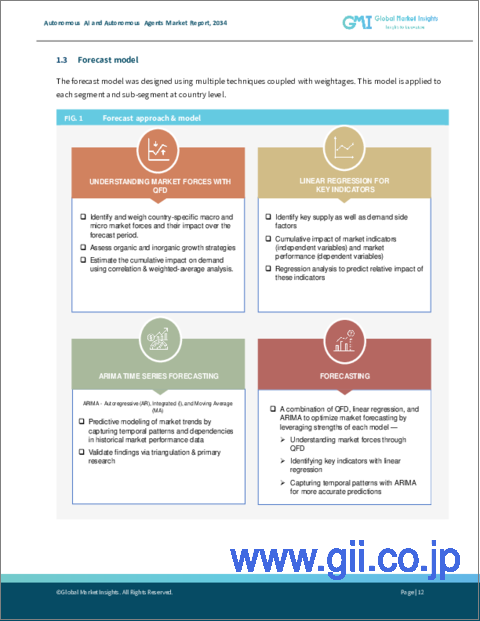
- 1.3 Forecast model
- 1.4 Primary research and validation
- 1.4.1 Primary sources
- 1.4.2 Data mining sources
- 1.5 Market scope & definition
Chapter 2 Executive Summary
- 2.1 Industry 360° synopsis, 2021 - 2034
Chapter 3 Industry Insights
- 3.1 Industry ecosystem analysis
- 3.1.1 Hardware providers
- 3.1.2 Software providers
- 3.1.3 Cloud service providers
- 3.1.4 System integrators
- 3.1.5 End users
- 3.2 Supplier landscape
- 3.3 Profit margin analysis
- 3.4 Technology & innovation landscape
- 3.5 Patent analysis
- 3.6 Key news & initiatives
- 3.7 Regulatory landscape
- 3.8 Government investment in AI, by region
- 3.9 Consumer and end-user insights
- 3.10 Impact forces
- 3.10.1 Growth drivers
- 3.10.1.1 Increasing global demand for automation and efficiency
- 3.10.1.2 Growing advancements in AI and Machine Learning (ML) technologies
- 3.10.1.3 Increasing adoption of cloud computing
- 3.10.1.4 Rising demand for autonomous AI and autonomous agents in the manufacturing sector
- 3.10.2 Industry pitfalls & challenges
- 3.10.2.1 Surge in government support for AI research & development
- 3.10.2.2 Safety and reliability concerns
- 3.10.1 Growth drivers
- 3.11 Growth potential analysis
- 3.12 Porter's analysis
- 3.13 PESTEL analysis
Chapter 4 Competitive Landscape, 2024
- 4.1 Introduction
- 4.2 Company market share analysis
- 4.3 Competitive positioning matrix
- 4.4 Strategic outlook matrix
Chapter 5 Market Estimates & Forecast, By Component, 2021 - 2034 ($Bn)
- 5.1 Key trends
- 5.2 Hardware
- 5.3 Software
- 5.4 Services
Chapter 6 Market Estimates & Forecast, By Deployment Model, 2021 - 2034 ($Bn)
- 6.1 Key trends
- 6.2 On-premises
- 6.3 Cloud
Chapter 7 Market Estimates & Forecast, By Enterprise Size, 2021 - 2034 ($Bn)
- 7.1 Key trends
- 7.2 Large enterprises
- 7.3 SME
Chapter 8 Market Estimates & Forecast, By Technology, 2021 - 2034 ($Bn)
- 8.1 Key trends
- 8.2 Machine learning
- 8.3 NLP
- 8.4 Context awareness
- 8.5 Computer vision
Chapter 9 Market Estimates & Forecast, By Industry Vertical, 2021 - 2034 ($Bn)
- 9.1 Key trends
- 9.2 Retail & e-commerce
- 9.3 BFSI
- 9.4 IT & telecom
- 9.5 Manufacturing
- 9.6 Healthcare & lifesciences
- 9.7 Government & defense
- 9.8 Automotive
- 9.9 Energy & power
- 9.10 Others
Chapter 10 Market Estimates & Forecast, By Region, 2021 - 2034 ($Bn)
- 10.1 Key trends
- 10.2 North America
- 10.2.1 U.S.
- 10.2.2 Canada
- 10.3 Europe
- 10.3.1 UK
- 10.3.2 Germany
- 10.3.3 France
- 10.3.4 Italy
- 10.3.5 Spain
- 10.3.6 Russia
- 10.3.7 Nordics
- 10.4 Asia Pacific
- 10.4.1 China
- 10.4.2 India
- 10.4.3 Japan
- 10.4.4 Australia
- 10.4.5 South Korea
- 10.4.6 Southeast Asia
- 10.5 Latin America
- 10.5.1 Brazil
- 10.5.2 Mexico
- 10.5.3 Argentina
- 10.6 MEA
- 10.6.1 UAE
- 10.6.2 South Africa
- 10.6.3 Saudi Arabia
Chapter 11 Company Profiles
- 11.1 Aerogility
- 11.2 AgentGPT
- 11.3 AWS
- 11.4 Baidu
- 11.5 C3.ai
- 11.6 Deepmind
- 11.7 Fetch.ai
- 11.8 Genesys
- 11.9 Google
- 11.10 H20.ai
- 11.11 IBM
- 11.12 Microsoft
- 11.13 Nvidia Corporation
- 11.14 OpenAI
- 11.15 Oracle
- 11.16 Rezolve AI Limited
- 11.17 Salesforce
- 11.18 SAP SE
- 11.19 SAS Institute
