
|
市場調査レポート
商品コード
1667015
実用規模中電圧スイッチギヤ市場の機会、成長促進要因、産業動向分析、2025年~2034年の予測Utility Scale Medium Voltage Switchgear Market Opportunity, Growth Drivers, Industry Trend Analysis, and Forecast 2025 - 2034 |
||||||
カスタマイズ可能
|
|||||||
| 実用規模中電圧スイッチギヤ市場の機会、成長促進要因、産業動向分析、2025年~2034年の予測 |
|
出版日: 2024年12月20日
発行: Global Market Insights Inc.
ページ情報: 英文 100 Pages
納期: 2~3営業日
|

全表示
- 概要
- 目次
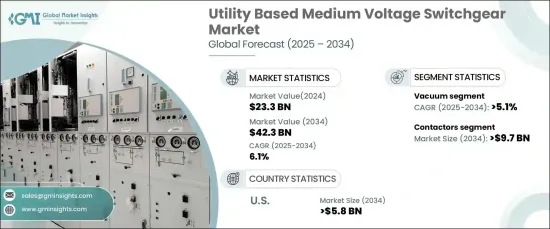
実用規模中電圧スイッチギヤの世界市場は、2024年に233億米ドルの規模に達し、2025年から2034年にかけてCAGR 6.1%で拡大すると予測されています。
先進国における電力消費の増加とインフラの老朽化により、信頼性の高い配電システムへの需要が高まっていることが、この成長の主な要因となっています。世界各国の政府は、産業の電化と脱炭素化への取り組みを重視しており、これが送電網インフラへの投資の増加につながっています。
また、風力や太陽光などの再生可能エネルギーを送電網に統合することで、中電圧スイッチギヤの需要にも拍車がかかっています。スマートグリッド技術と高度な監視ソリューションの組み合わせは、電力会社が配電を管理する方法を変えつつあります。これらの技術は、リアルタイムの故障検知を可能にし、システムの信頼性を高めることで、運用効率を向上させています。さらに、送電網の近代化と送電網管理のデジタル化に注目が集まっていることから、予知保全とエネルギー最適化ソリューションの利用が促進され、ユーティリティ企業が費用対効果の高い高性能な運用を実現できるようになっています。
| 市場範囲 | |
|---|---|
| 開始年 | 2024 |
| 予測年 | 2025-2034 |
| 開始金額 | 233億米ドル |
| 予測金額 | 423億米ドル |
| CAGR | 6.1% |
市場拡大の原動力のひとつはコンタクターの役割であり、2034年までに97億米ドルの売上が見込まれています。これらのデバイスは、産業用アプリケーション、再生可能エネルギー・プロジェクト、電力網の近代化への取り組みにおいて不可欠です。中電圧システム内の電気回路を管理、切り替え、保護し、高い信頼性と効率を提供します。再生可能エネルギー設備、特に風力発電所や太陽光発電所の増加に伴い、中電圧コンタクターの必要性が高まっています。コンタクターは、変動するエネルギー負荷を管理し、配電の安定性を確保するために極めて重要だからです。
絶縁分野も成長を遂げており、真空絶縁タイプは2034年までにCAGR 5.1%で拡大すると予測されています。この成長は、真空の環境面での利点と、最新の電力システムにおける優れた性能に起因しています。真空絶縁技術は、最小限のメンテナンスで効率的なアーク消弧を実現するため、中電圧アプリケーションにとって魅力的な選択肢となっています。さらに、世界の焦点が持続可能性にシフトする中、温室効果ガスであるSF6ガスを使用しない真空絶縁スイッチギアが人気を集めています。これは世界の環境目標に合致し、送電網全体の炭素排出量削減をサポートします。
米国の公益事業規模の中電圧スイッチギヤ市場は、2034年までに58億米ドルを創出すると予測されています。この成長の原動力は、送電網の近代化、再生可能エネルギーの統合、インフラのアップグレードへの継続的な投資です。クリーンエネルギーの導入と脱炭素化を促進する連邦政策により、風力発電所と太陽光発電所の展開が加速しており、これらのエネルギー源が提供するダイナミックなエネルギー入力に対応できる高度なスイッチギア・ソリューションに対する需要がさらに高まっています。
目次
第1章 調査手法と調査範囲
- 市場の定義
- 基本推定と計算
- 予測計算
- データソース
- 1次データ
- 2次データ
- 有償
- 公的
第2章 エグゼクティブサマリー
第3章 業界洞察
- エコシステム分析
- 規制状況
- 業界への影響要因
- 促進要因
- 業界の潜在的リスク&課題
- 成長可能性分析
- ポーターの分析
- 供給企業の交渉力
- 買い手の交渉力
- 新規参入業者の脅威
- 代替品の脅威
- PESTEL分析
第4章 競合情勢
- 戦略ダッシュボード
- イノベーションと持続可能性の展望
第5章 市場規模・予測:成分別、2021年~2034年
- 主要動向
- サーキットブレーカー
- コンタクタ
- スイッチ&ディスコネクト
- ヒューズ
- その他
第6章 市場規模・予測:絶縁体別、2021年~2034年
- 主要動向
- 空気
- ガス
- オイル
- 真空
- その他
第7章 市場規模・予測:地域別、2021年~2034年
- 主要動向
- 北米
- 米国
- カナダ
- メキシコ
- 欧州
- 英国
- フランス
- ドイツ
- イタリア
- ロシア
- スペイン
- アジア太平洋
- 中国
- オーストラリア
- インド
- 日本
- 韓国
- 中東・アフリカ
- サウジアラビア
- アラブ首長国連邦
- トルコ
- 南アフリカ
- エジプト
- ラテンアメリカ
- ブラジル
- アルゼンチン
第8章 企業プロファイル
- ABB
- Bharat Heavy Electricals
- CG Power and Industrial Solutions
- E+I Engineering
- Eaton
- Fuji Electric
- General Electric
- HD Hyundai Electric
- Hitachi
- Hyosung Heavy Industries
- Lucy Group
- Mitsubishi Electric
- Ormazabal
- Schneider Electric
- Siemens
- Skema
- Toshiba
The Global Utility Scale Medium Voltage Switchgear Market reached a value of USD 23.3 billion in 2024 and is expected to expand at a CAGR of 6.1% from 2025 to 2034. The increasing demand for reliable power distribution systems, driven by rising electricity consumption and aging infrastructure in developed nations, is a major factor contributing to this growth. Governments across the globe are emphasizing the electrification of industries and decarbonization efforts, which are leading to increased investments in grid infrastructure.
The demand for medium voltage switchgear is also being fueled by the integration of renewable energy sources, such as wind and solar, into the power grid. Smart grid technology, combined with advanced monitoring solutions, is transforming how utilities manage power distribution. These technologies improve operational efficiency by enabling real-time fault detection and enhancing system reliability. Furthermore, the growing focus on grid modernization and digitalization in grid management is promoting the use of predictive maintenance and energy optimization solutions, ensuring that utilities can achieve cost-effective, high-performance operations.
| Market Scope | |
|---|---|
| Start Year | 2024 |
| Forecast Year | 2025-2034 |
| Start Value | $23.3 Billion |
| Forecast Value | $42.3 Billion |
| CAGR | 6.1% |
One of the driving forces behind market expansion is the role of contactors, which are anticipated to generate USD 9.7 billion by 2034. These devices are essential in industrial applications, renewable energy projects, and efforts to modernize the electrical grid. They manage, switch, and protect electrical circuits within medium-voltage systems, offering high reliability and efficiency. With the rise in renewable energy installations, particularly wind and solar farms, the need for medium-voltage contactors is intensifying. This is because contactors are crucial for managing fluctuating energy loads and ensuring the stability of power distribution.
The insulation segment is also witnessing growth, with the vacuum insulation type projected to expand at a CAGR of 5.1% by 2034. This growth can be attributed to the vacuum's environmental benefits and its superior performance in modern power systems. Vacuum insulation technology provides efficient arc extinction while requiring minimal maintenance, making it an attractive option for medium-voltage applications. Additionally, as the global focus shifts towards sustainability, vacuum-insulated switchgear is gaining traction due to its elimination of SF6 gas-a potent greenhouse gas. This aligns with global environmental goals and supports the reduction of carbon emissions across power grids.
The U.S. utility-scale medium voltage switchgear market is forecast to generate USD 5.8 billion by 2034. This growth is driven by continuous investments in grid modernization, renewable energy integration, and infrastructure upgrades. Federal policies promoting clean energy adoption and decarbonization are accelerating the deployment of wind and solar farms, further increasing the demand for advanced switchgear solutions capable of handling the dynamic energy inputs these sources provide.
Table of Contents
Chapter 1 Methodology & Scope
- 1.1 Market definitions
- 1.2 Base estimates & calculations
- 1.3 Forecast calculation
- 1.4 Data sources
- 1.4.1 Primary
- 1.4.2 Secondary
- 1.4.2.1 Paid
- 1.4.2.2 Public
Chapter 2 Executive Summary
- 2.1 Industry synopsis, 2021 - 2034
Chapter 3 Industry Insights
- 3.1 Industry ecosystem analysis
- 3.2 Regulatory landscape
- 3.3 Industry impact forces
- 3.3.1 Growth drivers
- 3.3.2 Industry pitfalls & challenges
- 3.4 Growth potential analysis
- 3.5 Porter's analysis
- 3.5.1 Bargaining power of suppliers
- 3.5.2 Bargaining power of buyers
- 3.5.3 Threat of new entrants
- 3.5.4 Threat of substitutes
- 3.6 PESTEL analysis
Chapter 4 Competitive landscape, 2024
- 4.1 Strategic dashboard
- 4.2 Innovation & sustainability landscape
Chapter 5 Market Size and Forecast, By Component, 2021 – 2034 (USD Million, ‘000 Units)
- 5.1 Key trends
- 5.2 Circuit breakers
- 5.3 Contactors
- 5.4 Switches & disconnector
- 5.5 Fuses
- 5.6 Others
Chapter 6 Market Size and Forecast, By Insulation, 2021 – 2034 (USD Million, ‘000 Units)
- 6.1 Key trends
- 6.2 Air
- 6.3 Gas
- 6.4 Oil
- 6.5 Vacuum
- 6.6 Others
Chapter 7 Market Size and Forecast, By Region, 2021 – 2034 (USD Million, ‘000 Units)
- 7.1 Key trends
- 7.2 North America
- 7.2.1 U.S.
- 7.2.2 Canada
- 7.2.3 Mexico
- 7.3 Europe
- 7.3.1 UK
- 7.3.2 France
- 7.3.3 Germany
- 7.3.4 Italy
- 7.3.5 Russia
- 7.3.6 Spain
- 7.4 Asia Pacific
- 7.4.1 China
- 7.4.2 Australia
- 7.4.3 India
- 7.4.4 Japan
- 7.4.5 South Korea
- 7.5 Middle East & Africa
- 7.5.1 Saudi Arabia
- 7.5.2 UAE
- 7.5.3 Turkey
- 7.5.4 South Africa
- 7.5.5 Egypt
- 7.6 Latin America
- 7.6.1 Brazil
- 7.6.2 Argentina
Chapter 8 Company Profiles
- 8.1 ABB
- 8.2 Bharat Heavy Electricals
- 8.3 CG Power and Industrial Solutions
- 8.4 E + I Engineering
- 8.5 Eaton
- 8.6 Fuji Electric
- 8.7 General Electric
- 8.8 HD Hyundai Electric
- 8.9 Hitachi
- 8.10 Hyosung Heavy Industries
- 8.11 Lucy Group
- 8.12 Mitsubishi Electric
- 8.13 Ormazabal
- 8.14 Schneider Electric
- 8.15 Siemens
- 8.16 Skema
- 8.17 Toshiba

