
|
市場調査レポート
商品コード
1685099
保護包装市場の機会、成長促進要因、産業動向分析、2025年~2034年の予測Protective Packaging Market Opportunity, Growth Drivers, Industry Trend Analysis, and Forecast 2025 - 2034 |
||||||
カスタマイズ可能
|
|||||||
| 保護包装市場の機会、成長促進要因、産業動向分析、2025年~2034年の予測 |
|
出版日: 2025年01月08日
発行: Global Market Insights Inc.
ページ情報: 英文 210 Pages
納期: 2~3営業日
|

全表示
- 概要
- 目次
世界の保護包装市場は2024年に347億米ドルに達し、2025年から2034年にかけて6.1%のCAGRで堅調に成長すると予測されています。
この成長の主な要因は、eコマースやロジスティクス分野からの保護包装ソリューションに対する需要の増加です。オンラインショッピングの継続的な台頭と世界貿易の拡大により、安全な包装ソリューションの必要性はかつてないほど高まっています。eコマース大手が繁栄を続ける中、保護包装市場は持続的な成長を遂げると思われます。さらに、新興国における工業化は、特に保管や輸送中の製品を保護するための先進パッケージング・ソリューションに対する需要の高まりを生み出しています。さまざまな分野の企業が包装戦略の改善を模索する中、保護包装ソリューション市場は今後10年間で大きく成長する見通しです。
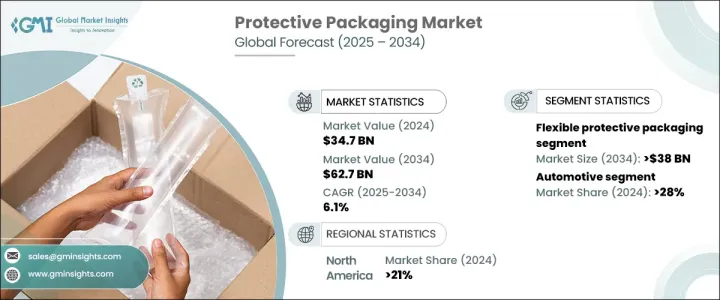
保護包装市場は、製品タイプ別に発泡、硬質、軟質の保護包装に区分され、軟質包装が業界の支配的勢力として台頭しています。このセグメントはCAGR 6.5%で成長し、2034年までに380億米ドルを超えると予想されています。フレキシブル保護包装は、その適応性、軽量設計、費用対効果により支持されています。この包装形態は、様々な産業に不可欠な幅広い保護ソリューションを提供します。スペース効率に優れ、持続可能で多用途な包装オプションに対する需要の高まりに対応し、保護と環境配慮の両立を目指す企業にとって好ましい選択肢となっています。
| 市場範囲 | |
|---|---|
| 開始年 | 2024 |
| 予測年 | 2025-2034 |
| 開始金額 | 347億米ドル |
| 予測金額 | 627億米ドル |
| CAGR | 6.1% |
市場を最終用途別に見ると、自動車産業が突出しており、2024年には28%のシェアを占める。自動車産業では、製造、輸送、組み立ての際に壊れやすい部品を保護する必要があるため、保護包装への依存度が高いです。電気自動車(EV)の台頭で自動車産業が進化するにつれ、高品質の保護パッケージング・ソリューションに対する需要は増加の一途をたどっています。これらのパッケージング・ソリューションは、デリケートな部品を安全に目的地に届け、損傷のリスクを最小限に抑え、サプライ・チェーンの効率を最適化する上で極めて重要です。
2024年に世界の保護包装市場の21%を占めた北米は、依然として業界の主要プレーヤーです。この地域は、堅調なeコマース、成長するロジスティクス部門、ヘルスケアやエレクトロニクスなどの業界における特殊なパッケージング・ソリューションに対する需要の増加から利益を得ています。例えば、ヘルスケア分野では温度に敏感な製品は特殊な包装を必要とし、エレクトロニクス業界では繊細な部品に帯電防止包装が求められます。さらに、この地域ではスマートテクノロジーと自動化の採用が包装業界に変革をもたらし、より高い効率性と強化された保護機能を提供しています。eコマースが成長を続ける中、北米の保護包装市場は、技術革新と物流網の改善により、確固たる地位を維持すると予想されます。米国は、その高度なインフラと産業能力により、この成長において極めて重要な役割を果たしています。カナダも、特に拡大するeコマース部門を通じて大きく貢献しています。
目次
第1章 調査手法と調査範囲
- 市場範囲と定義
- 基本推定と計算
- 予測計算
- データソース
第2章 エグゼクティブサマリー
第3章 業界洞察
- エコシステム分析
- バリューチェーンに影響を与える要因
- ディスラプション
- 将来の展望
- メーカー
- 流通業者
- 利益率分析
- 主なニュースと取り組み
- 規制状況
- 影響要因
- 促進要因
- eコマース売上の増加
- 世界・サプライチェーンの拡大
- エレクトロニクス産業の成長
- ヘルスケア産業からの需要の増加
- 製品安全の重要性に対する意識の高まり
- 業界の潜在的リスク&課題
- 原材料コストの上昇
- 環境問題への懸念
- 促進要因
- 成長可能性分析
- ポーター分析
- PESTEL分析
第4章 競合情勢
- イントロダクション
- 企業シェア分析
- 競合のポジショニング・マトリックス
- 戦略展望マトリックス
第5章 市場推計・予測:製品タイプ別、2021年~2034年
- 主要動向
- 発泡保護包装
- 硬質保護包装
- 軟質保護包装
第6章 市場推計・予測:材料別、2021年~2034年
- 主要動向
- 紙・板紙
- プラスチックフォーム
- プラスチック
- その他
第7章 市場推計・予測:機能別、2021年~2034年
- 主要動向
- クッション
- ラッピング
- ボイドフィル
- 断熱材
- ブロッキング&ブレース
第8章 市場推計・予測:最終用途別、2021年~2034年
- 主要動向
- 自動車
- ヘルスケア
- 工業製品
- 飲食品
- 家電製品
- その他
第9章 市場推計・予測:地域別、2021年~2034年
- 主要動向
- 北米
- 米国
- カナダ
- 欧州
- 英国
- ドイツ
- フランス
- イタリア
- スペイン
- ロシア
- アジア太平洋
- 中国
- インド
- 日本
- 韓国
- オーストラリア
- ラテンアメリカ
- ブラジル
- メキシコ
- 中東・アフリカ
- 南アフリカ
- サウジアラビア
- アラブ首長国連邦
第10章 企業プロファイル
- DS Smith
- EcoEnclose
- Huhtamaki
- International Paper
- Intertape Polymer
- Mondi
- Pacfo International
- Pregis
- Pro-Pac Packaging
- Protective Packaging
- Sealed Air
- Signode Industrial
- Smurfit Kappa
- Sonoco Products
- Storopack
- Supreme Industries
- Swiftpak
- UFP Industries
- Universal Protective Packaging
- WestRock
The Global Protective Packaging Market reached USD 34.7 billion in 2024 and is projected to grow at a robust CAGR of 6.1% from 2025 to 2034. This growth is primarily driven by the increasing demand for protective packaging solutions from the e-commerce and logistics sectors. With the continued rise of online shopping and the expansion of global trade, the need for secure packaging solutions has never been more critical. As e-commerce giants continue to thrive, the market for protective packaging is set to experience sustained growth. Furthermore, industrialization in emerging economies is creating a heightened demand for advanced packaging solutions, particularly for safeguarding products during storage and transportation. As businesses across various sectors seek to improve their packaging strategies, the market for protective packaging solutions is poised to flourish in the coming decade.
The protective packaging market is segmented by product type into foam, rigid, and flexible protective packaging, with flexible packaging emerging as a dominant force in the industry. This segment is expected to grow at a CAGR of 6.5%, surpassing USD 38 billion by 2034. Flexible protective packaging is favored due to its adaptability, lightweight design, and cost-effectiveness. This form of packaging offers a broad range of protective solutions that are essential to various industries. It meets the growing demand for space-efficient, sustainable, and versatile packaging options, making it a preferred choice for companies looking to balance protection with environmental concerns.
| Market Scope | |
|---|---|
| Start Year | 2024 |
| Forecast Year | 2025-2034 |
| Start Value | $34.7 Billion |
| Forecast Value | $62.7 Billion |
| CAGR | 6.1% |
When examining the market by end-use, the automotive sector stands out, holding a 28% share of the market in 2024. The automotive industry's reliance on protective packaging is significant, given the need to protect fragile components during manufacturing, transportation, and assembly. As the automotive industry evolves with the rise of electric vehicles (EVs), the demand for high-quality protective packaging solutions continues to increase. These packaging solutions are critical in ensuring that delicate parts reach their destination safely, minimizing the risk of damage, and optimizing supply chain efficiency.
North America, which accounted for 21% of the global protective packaging market in 2024, remains a key player in the industry. The region benefits from a robust e-commerce landscape, a growing logistics sector, and an increased demand for specialized packaging solutions in industries like healthcare and electronics. For instance, temperature-sensitive products in the healthcare sector require specialized packaging, while the electronics industry demands anti-static packaging for sensitive components. Furthermore, the adoption of smart technologies and automation in the region is transforming the packaging industry, offering greater efficiency and enhanced protective capabilities. As e-commerce continues to grow, North America's protective packaging market is expected to maintain a strong position, driven by technological innovation and improved logistics networks. The United States plays a pivotal role in this growth with its advanced infrastructure and industrial capabilities. Canada, too, is contributing significantly, particularly through its expanding e-commerce sector.
Table of Contents
Chapter 1 Methodology & Scope
- 1.1 Market scope & definitions
- 1.2 Base estimates & calculations
- 1.3 Forecast calculations
- 1.4 Data sources
- 1.4.1 Primary
- 1.4.2 Secondary
- 1.4.2.1 Paid sources
- 1.4.2.2 Public sources
Chapter 2 Executive Summary
- 2.1 Industry synopsis, 2021-2034
Chapter 3 Industry Insights
- 3.1 Industry ecosystem analysis
- 3.1.1 Factor affecting the value chain
- 3.1.2 Disruptions
- 3.1.3 Future outlook
- 3.1.4 Manufacturers
- 3.1.5 Distributors
- 3.2 Profit margin analysis
- 3.3 Key news & initiatives
- 3.4 Regulatory landscape
- 3.5 Impact forces
- 3.5.1 Growth drivers
- 3.5.1.1 Rising e-commerce sales
- 3.5.1.2 Global supply chain expansion
- 3.5.1.3 Growth in electronics industry
- 3.5.1.4 Increasing demand from healthcare industry
- 3.5.1.5 Growing awareness about the importance of product safety
- 3.5.2 Industry pitfalls & challenges
- 3.5.2.1 Rising raw material costs
- 3.5.2.2 Environmental concerns
- 3.5.1 Growth drivers
- 3.6 Growth potential analysis
- 3.7 Porter’s analysis
- 3.8 PESTEL analysis
Chapter 4 Competitive Landscape, 2024
- 4.1 Introduction
- 4.2 Company market share analysis
- 4.3 Competitive positioning matrix
- 4.4 Strategic outlook matrix
Chapter 5 Market Estimates & Forecast, By Product Type, 2021-2034 (USD Billion & Kilo Tons)
- 5.1 Key trends
- 5.2 Foam protective packaging
- 5.3 Rigid protective packaging
- 5.4 Flexible protective packaging
Chapter 6 Market Estimates & Forecast, By Material, 2021-2034 (USD Billion & Kilo Tons)
- 6.1 Key trends
- 6.2 Paper & paperboard
- 6.3 Plastic foams
- 6.4 Plastic
- 6.5 Others
Chapter 7 Market Estimates & Forecast, By Function, 2021-2034 (USD Billion & Kilo Tons)
- 7.1 Key trends
- 7.2 Cushioning
- 7.3 Wrapping
- 7.4 Void Fill
- 7.5 Insulation
- 7.6 Blocking & bracing
Chapter 8 Market Estimates & Forecast, By End Use, 2021-2034 (USD Billion & Kilo Tons)
- 8.1 Key trends
- 8.2 Automotive
- 8.3 Healthcare
- 8.4 Industrial goods
- 8.5 Food & beverage
- 8.6 Household appliances
- 8.7 Others
Chapter 9 Market Estimates & Forecast, By Region, 2021-2034 (USD Billion & Kilo Tons)
- 9.1 Key trends
- 9.2 North America
- 9.2.1 U.S.
- 9.2.2 Canada
- 9.3 Europe
- 9.3.1 UK
- 9.3.2 Germany
- 9.3.3 France
- 9.3.4 Italy
- 9.3.5 Spain
- 9.3.6 Russia
- 9.4 Asia Pacific
- 9.4.1 China
- 9.4.2 India
- 9.4.3 Japan
- 9.4.4 South Korea
- 9.4.5 Australia
- 9.5 Latin America
- 9.5.1 Brazil
- 9.5.2 Mexico
- 9.6 MEA
- 9.6.1 South Africa
- 9.6.2 Saudi Arabia
- 9.6.3 UAE
Chapter 10 Company Profiles
- 10.1 DS Smith
- 10.2 EcoEnclose
- 10.3 Huhtamaki
- 10.4 International Paper
- 10.5 Intertape Polymer
- 10.6 Mondi
- 10.7 Pacfo International
- 10.8 Pregis
- 10.9 Pro-Pac Packaging
- 10.10 Protective Packaging
- 10.11 Sealed Air
- 10.12 Signode Industrial
- 10.13 Smurfit Kappa
- 10.14 Sonoco Products
- 10.15 Storopack
- 10.16 Supreme Industries
- 10.17 Swiftpak
- 10.18 UFP Industries
- 10.19 Universal Protective Packaging
- 10.20 WestRock

