
|
市場調査レポート
商品コード
1741030
地震サービス市場の市場機会、成長促進要因、産業動向分析、2025年~2034年予測Seismic Services Market Opportunity, Growth Drivers, Industry Trend Analysis, and Forecast 2025 - 2034 |
||||||
カスタマイズ可能
|
|||||||
| 地震サービス市場の市場機会、成長促進要因、産業動向分析、2025年~2034年予測 |
|
出版日: 2025年04月17日
発行: Global Market Insights Inc.
ページ情報: 英文 124 Pages
納期: 2~3営業日
|

全表示
- 概要
- 目次
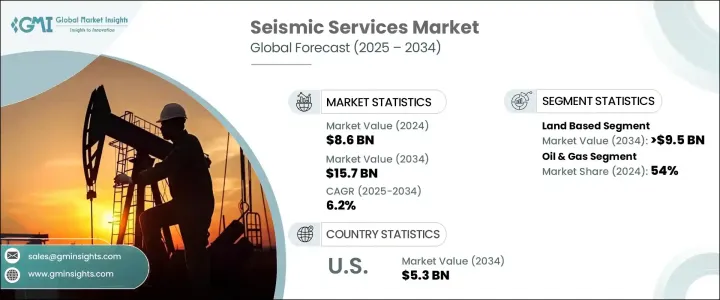
世界の地震サービス市場は、2024年には86億米ドルと評価され、2034年には157億米ドルに達するまでCAGR 6.2%で成長すると予測されています。
これは、世界のエネルギー探査技術の大きなシフト、高解像度の地下イメージングへの依存度の高まり、次世代物理学技術の急速な採用が原動力となっています。世界がよりデータ主導の探査に向かう中、地震サービスはエネルギー開発戦略の重要な柱へと進化しています。今日のオペレーターは、地下構造についてのより迅速で正確な洞察を求めており、地震探査プロバイダーは統合されたデジタルファーストのソリューションを提供するよう求められています。エネルギー部門が化石燃料と再生可能エネルギーのバランスを取るという大きな転換期を迎えている中、地震探査技術の役割は石油・ガスにとどまらず、洋上風力、地熱、鉱業などの分野にも拡大しつつあります。規制の義務付けや環境評価に後押しされ、持続可能な探査が重視されるようになったことで、地震探査の技術革新への投資の流れが変わりつつあります。企業は、3Dや4D地震探査のような高度なイメージング技術を採用するだけでなく、機械学習やAIをデータ処理に導入し、業務の合理化、コスト削減、意思決定速度の向上を図っています。世界のエネルギー需要が複雑化する中、地震サービス市場は、よりスマートでクリーンかつ効率的な資源探査を可能にする重要な存在として位置づけられています。
原油価格の不確実性と地政学的シナリオの変化は、探査予算と地震探査サービス量に影響を与え続けています。イノベーションを推進し、能力を拡大するためには、サービス会社とエネルギー生産者の協力が不可欠です。重要な地震探査機器や資材に対する関税は運用コストを上昇させ、世界の協力を鈍らせ、最先端技術へのアクセスを制限する恐れがあります。とはいえ、企業は現地調達戦略やデジタル革新を通じて適応する方法を見出しています。
| 市場範囲 | |
|---|---|
| 開始年 | 2024 |
| 予測年 | 2025-2034 |
| 開始金額 | 86億米ドル |
| 予測金額 | 157億米ドル |
| CAGR | 6.2% |
陸上ベースの地震サービスが業界を支配すると予想され、予測収益は2034年までに95億米ドルに達します。これらの調査は、費用対効果に優れ、高度な3Dおよび4Dイメージングによって精度が向上しているため、上流の探査では依然として不可欠です。土地取得技術における継続的な技術革新により、多様な地形で詳細な地下評価を実施することが容易になり、探査成果が大幅に向上しています。
2024年には、石油・ガス部門が54%の圧倒的シェアを占め、探査リスクの低減と資源ターゲットの改善を目的としたAI主導の地震探査解析に関するワークフローの増加がその原動力となっています。また、洋上風力発電や地熱発電のプロジェクトでは、環境影響評価や立地可能性調査のための地震探査イメージングへの依存度が高まっており、地震探査ツールの関連性が業界全体に広がっていることが浮き彫りになっています。
米国の地震サービス市場は2024年に29億米ドルを生み出し、2034年には53億米ドルに達すると予測されています。シェール盆地やメキシコ湾などの沖合地域での探査と生産が引き続き需要を促進しています。プロバイダーは、機械学習、リアルタイム画像処理、高度なデータ処理技術を統合し、生産性を向上させ、特に再生可能プロジェクトの規制基準の強化に対応しています。
Halliburton、Paradigm Group B.V.、CGG、TGS、Gardline Limited、SLB、Fugro、Getech Group plc、PGS、Spectrum Geophysics、SAExploration、Ramboll Group A/S、NUVIA Dynamics Inc.、Weatherford、China Oilfield Services Limited、EGS(International)Ltd、Dawson Geophysical Company、Abitibi Geophysicsなどの主要企業は、市場でのプレゼンスを積極的に強化しています。各社の戦略には、リアルタイムの地震データ解析への投資、オフショア能力の拡大、エネルギープロバイダーとの合弁事業の設立、AIを活用したデータワークフローの合理化、持続可能で低負荷の地震探査技術による再生可能セクターのターゲット化などが含まれます。
目次
第1章 調査手法と範囲
第2章 エグゼクティブサマリー
第3章 業界考察
- エコシステム分析
- トランプ政権の関税分析
- 貿易への影響
- 貿易量の混乱
- 報復措置
- 業界への影響
- 供給側の影響(原材料)
- 主要原材料の価格変動
- サプライチェーンの再構築
- 生産コストへの影響
- 需要側の影響(販売価格)
- 最終市場への価格伝達
- 市場シェアの動向
- 消費者の反応パターン
- 供給側の影響(原材料)
- 影響を受ける主要企業
- 戦略的な業界対応
- サプライチェーンの再構成
- 価格設定と製品戦略
- 政策関与
- 展望と今後の検討事項
- 貿易への影響
- 規制情勢
- 業界への影響要因
- 促進要因
- 業界の潜在的リスク&課題
- 成長可能性分析
- ポーター分析
- PESTEL分析
第4章 競合情勢
- 戦略的ダッシュボード
- イノベーションと持続可能性の情勢
第5章 市場規模・予測調査タイプ別、2021-2034
- 主要動向
- 陸上ベース
- 海洋ベース
第6章 市場規模・予測:最終用途別、2021-2034
- 主要動向
- 石油・ガス
- 鉱業
- その他
第7章 市場規模・予測:地域別、2021-2034
- 主要動向
- 北米
- 米国
- カナダ
- 欧州
- 英国
- ドイツ
- フランス
- ノルウェー
- ロシア
- アジア太平洋地域
- 中国
- 日本
- インド
- オーストラリア
- 中東・アフリカ
- アラブ首長国連邦
- サウジアラビア
- イラク
- イラン
- 南アフリカ
- ラテンアメリカ
- ブラジル
- アルゼンチン
第8章 企業プロファイル
- Abitibi Geophysics
- China Oilfield Services Limited
- CGG
- Dawson Geophysical Company
- EGS(International)Ltd
- Fugro
- Getech Group plc
- Gardline Limited
- Halliburton
- NUVIA Dynamics Inc.
- PGS
- Paradigm Group B.V.
- Ramboll Group A/S
- SLB
- SAExploration
- Spectrum Geophysics
- TGS
- Weatherford
The Global Seismic Services Market was valued at USD 8.6 billion in 2024 and is estimated to grow at a CAGR of 6.2% to reach USD 15.7 billion by 2034, driven by major shifts in global energy exploration techniques, growing reliance on high-resolution subsurface imaging, and the rapid adoption of next-gen geophysical technologies. As the world moves toward more data-driven exploration, seismic services are evolving into a critical pillar of energy development strategies. Operators today demand faster, more accurate insights into subsurface structures, pushing seismic providers to deliver integrated, digital-first solutions. With the energy sector undergoing a major transition-balancing fossil fuels with renewables-the role of seismic technologies is expanding beyond oil and gas, penetrating sectors like offshore wind, geothermal, and mining. A rising emphasis on sustainable exploration, fueled by regulatory mandates and environmental assessments, is reshaping investment flows into seismic innovation. Companies are not only adopting advanced imaging techniques like 3D and 4D seismic but also infusing machine learning and AI into data processing to streamline operations, cut costs, and improve decision-making speed. As global energy demands grow more complex, the seismic services market is positioned as a crucial enabler of smarter, cleaner, and more efficient resource exploration.
Uncertainty in oil prices and shifting geopolitical scenarios continue to impact exploration budgets and seismic service volumes. Collaboration between service firms and energy producers remains vital to drive innovation and expand capabilities. Tariffs on critical seismic equipment and materials are increasing operational costs and could slow global cooperation, restricting access to cutting-edge technologies. Nevertheless, companies are finding ways to adapt through local sourcing strategies and digital innovation.
| Market Scope | |
|---|---|
| Start Year | 2024 |
| Forecast Year | 2025-2034 |
| Start Value | $8.6 Billion |
| Forecast Value | $15.7 Billion |
| CAGR | 6.2% |
Land-based seismic services are expected to dominate the industry, with projected revenues reaching USD 9.5 billion by 2034. These surveys remain essential in upstream exploration due to their cost-effectiveness and improved accuracy through advanced 3D and 4D imaging. Ongoing innovation in land acquisition technologies is making it easier to conduct detailed subsurface assessments across diverse terrains, significantly enhancing exploration outcomes.
In 2024, the oil and gas sector held a commanding 54% share, driven by rising workflow on AI-driven seismic analysis aimed at reducing exploration risks and improving resource targeting. The need for strategic minerals has fueled the adoption of seismic services in mining, while offshore wind and geothermal projects are increasingly relying on seismic imaging for environmental impact assessments and site viability studies, highlighting the broadening relevance of seismic tools across industries.
The U.S. Seismic Services Market generated USD 2.9 billion in 2024 and is projected to reach USD 5.3 billion by 2034. Exploration and production in shale basins and offshore areas such as the Gulf of Mexico continue to fuel demand. Providers are integrating machine learning, real-time imaging, and advanced data processing technologies to boost productivity and meet tightening regulatory standards, especially for renewable projects.
Leading players such as Halliburton, Paradigm Group B.V., CGG, TGS, Gardline Limited, SLB, Fugro, Getech Group plc, PGS, Spectrum Geophysics, SAExploration, Ramboll Group A/S, NUVIA Dynamics Inc., Weatherford, China Oilfield Services Limited, EGS (International) Ltd, Dawson Geophysical Company, and Abitibi Geophysics are actively consolidating their market presence. Their strategies include investing in real-time seismic data analytics, expanding offshore capabilities, forming joint ventures with energy providers, leveraging AI to streamline data workflows, and targeting the renewable sector through sustainable, low-impact seismic exploration techniques.
Table of Contents
Chapter 1 Methodology & Scope
- 1.1 Market definitions
- 1.2 Base estimates & calculations
- 1.3 Forecast calculation
- 1.4 Data sources
- 1.4.1 Primary
- 1.4.2 Secondary
- 1.4.2.1 Paid
- 1.4.2.2 Public
Chapter 2 Executive Summary
- 2.1 Industry synopsis, 2021 - 2034
Chapter 3 Industry Insights
- 3.1 Industry ecosystem analysis
- 3.2 Trump administration tariff analysis
- 3.2.1 Impact on trade
- 3.2.1.1 Trade volume disruptions
- 3.2.1.2 Retaliatory measures
- 3.2.2 Impact on the industry
- 3.2.2.1 Supply-side impact (raw materials)
- 3.2.2.1.1 Price volatility in key materials
- 3.2.2.1.2 Supply chain restructuring
- 3.2.2.1.3 Production cost implications
- 3.2.2.2 Demand-side impact (selling price)
- 3.2.2.2.1 Price transmission to end markets
- 3.2.2.2.2 Market share dynamics
- 3.2.2.2.3 Consumer response patterns
- 3.2.2.1 Supply-side impact (raw materials)
- 3.2.3 Key companies impacted
- 3.2.4 Strategic industry responses
- 3.2.4.1 Supply chain reconfiguration
- 3.2.4.2 Pricing and product strategies
- 3.2.4.3 Policy engagement
- 3.2.5 Outlook and future considerations
- 3.2.1 Impact on trade
- 3.3 Regulatory landscape
- 3.4 Industry impact forces
- 3.4.1 Growth drivers
- 3.4.2 Industry pitfalls & challenges
- 3.5 Growth potential analysis
- 3.6 Porter's analysis
- 3.6.1 Bargaining power of suppliers
- 3.6.2 Bargaining power of buyers
- 3.6.3 Threat of new entrants
- 3.6.4 Threat of substitutes
- 3.7 PESTEL analysis
Chapter 4 Competitive landscape, 2024
- 4.1 Strategic dashboard
- 4.2 Innovation & sustainability landscape
Chapter 5 Market Size and Forecast, By Survey Type, 2021 - 2034 (USD Million)
- 5.1 Key trends
- 5.2 Land based
- 5.3 Marine based
Chapter 6 Market Size and Forecast, By End Use, 2021 - 2034 (USD Million)
- 6.1 Key trends
- 6.2 Oil & gas
- 6.3 Mining
- 6.4 Others
Chapter 7 Market Size and Forecast, By Region, 2021 - 2034 (USD Million)
- 7.1 Key trends
- 7.2 North America
- 7.2.1 U.S.
- 7.2.2 Canada
- 7.3 Europe
- 7.3.1 UK
- 7.3.2 Germany
- 7.3.3 France
- 7.3.4 Norway
- 7.3.5 Russia
- 7.4 Asia Pacific
- 7.4.1 China
- 7.4.2 Japan
- 7.4.3 India
- 7.4.4 Australia
- 7.5 Middle East & Africa
- 7.5.1 UAE
- 7.5.2 Saudi Arabia
- 7.5.3 Iraq
- 7.5.4 Iran
- 7.5.5 South Africa
- 7.6 Latin America
- 7.6.1 Brazil
- 7.6.2 Argentina
Chapter 8 Company Profiles
- 8.1 Abitibi Geophysics
- 8.2 China Oilfield Services Limited
- 8.3 CGG
- 8.4 Dawson Geophysical Company
- 8.5 EGS (International) Ltd
- 8.6 Fugro
- 8.7 Getech Group plc
- 8.8 Gardline Limited
- 8.9 Halliburton
- 8.10 NUVIA Dynamics Inc.
- 8.11 PGS
- 8.12 Paradigm Group B.V.
- 8.13 Ramboll Group A/S
- 8.14 SLB
- 8.15 SAExploration
- 8.16 Spectrum Geophysics
- 8.17 TGS
- 8.18 Weatherford

