
避妊薬の市場機会と促進要因、業界動向分析、2025年~2034年予測
Contraceptives Market Opportunity, Growth Drivers, Industry Trend Analysis, and Forecast 2025 - 2034- 発行日
- ページ情報
- 英文 150 Pages
- 納期
- 2~3営業日
- 商品コード
- 1822646
- カスタマイズ可能 お客様のご希望に応じて、既存データの加工や未掲載情報(例:国別セグメント)の追加などの対応が可能です。詳細はお問い合わせください。
- 翻訳ツール提供対象 PDF対応AI翻訳ツールの無料貸し出しサービスのご利用が可能です
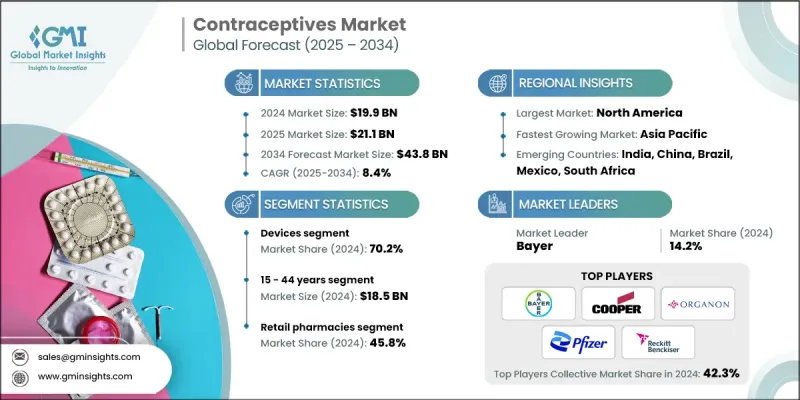
Global Market Insights Inc.が発行した最新レポートによると、世界の避妊薬市場は2024年に199億米ドルと推定され、CAGR 8.4%で2025年の211億米ドルから2034年には438億米ドルに成長すると予測されています。
リプロダクティブ・ライツ(性と生殖に関する権利)と家族計画に関する公衆衛生キャンペーンと教育の高まりは、避妊薬に対する認識と受容を高めています。NGOや政府の取り組み(UNFPA、WHOなど)は、先進地域と発展途上地域の両方において、最新の避妊薬へのアクセスを促進しています。
| 市場範囲 | |
|---|---|
| 開始年 | 2024 |
| 予測年 | 2025-2034 |
| 市場規模 | 199億米ドル |
| 予測金額 | 438億米ドル |
| CAGR | 8.4% |
デバイスの採用増加
2024年には、長時間作用型で可逆的な避妊オプションへの需要の高まりにより、デバイス分野が顕著なシェアを占めました。子宮内避妊器具(IUD)、コンドーム、インプラントなどの製品は、その有効性と利便性からますます支持されています。なかでも、ホルモン性IUDと銅製IUDは、高い成功率と長期的な避妊効果があるため、依然として上位の選択肢となっています。市場のプレーヤーは、より幅広い顧客層を惹きつけるために、製品の革新、快適性の向上、使用期間の延長に注力しています。
15~44歳における有病率の増加
15~44歳のセグメントは、生殖可能な年齢であり、家族計画に積極的に参加していることから、2024年には大きなシェアを占めています。このセグメントは、妊娠を遅らせたいという願望と、青少年や若年成人における性的健康意識に対するニーズの高まりによって牽引されています。教育的アウトリーチの増加、デジタルヘルスプラットフォーム、ターゲットを絞ったマーケティングキャンペーンは、この層における避妊具使用の正常化に役立っています。企業は、ライフスタイルへの適合性、使いやすさ、アクセスのしやすさなどを強調することで、この層の共感を得られるようメッセージを調整しています。また、プライバシーを重視するこの層のユーザーにアピールするため、定期購入モデルや目立たない配送サービスも導入されています。
牽引役となる小売薬局
小売薬局分野は、消費者の利便性、アクセスのしやすさ、匿名性を背景に、2025年から2034年にかけて適正なCAGRで成長すると思われます。経口薬や緊急用ピルの店頭での入手が可能になりつつあることから、同分野は着実な成長を遂げています。このセグメントはまた、薬局の営業時間の延長、半都市部での普及の拡大、生殖医療カウンセリングにおける薬剤師の役割の増加からも恩恵を受けています。製薬会社は自社のプレゼンスを強化するため、大手小売チェーンとパートナーシップを結び、販促割引を提供し、製品の安定供給を確保しています。
地域別洞察
北米が有利な地域として台頭
北米避妊薬市場は、高い消費者意識、有利な償還政策、強固なヘルスケアインフラに支えられ、2024年に大きな収益を上げました。米国はホルモン剤、IUD、緊急避妊ピルの普及によりこの地域をリードしています。最近の予測では、北米の市場推計・予測は80億米ドルを超えており、デジタル処方や消費者直結型遠隔医療サービスの利用可能性が高まるにつれて、着実に成長すると予測されています。この地域で事業を展開する企業は、FDA承認、製品の多様化、オンライン販売プラットフォームの拡大に注力し、進化する消費者行動に対応しています。
避妊薬市場の主要プレーヤーは、HLL Lifecare(インド)、ファイザー、LifeStylesヘルスケア、チャーチ&ドワイト、Exeltis、Reckitt、CooperSurgical、Medintim(ケッセル)、Organon、Pregna International、Evofem Biosciences、Mayne Pharma、Agile Therapeutics、バイエル、HRA Pharma/Perrigo(OTC)です。
避妊薬市場の企業は、その地位を維持・成長させるために、製品革新、地域拡大、顧客中心の取り組みを組み合わせて採用しています。最も顕著な戦略のひとつは、非ホルモン性避妊薬や男性用避妊薬など、より安全で効果的、かつ使いやすい製品を開発するための研究開発への投資です。さらに、各ブランドはデジタル・プラットフォームを活用し、遠隔健康相談やオンライン・フルフィルメント・サービスを提供することで、利便性への需要に応えています。
目次
第1章 調査手法と範囲
第2章 エグゼクティブサマリー
第3章 業界考察
- エコシステム分析
- 業界への影響要因
- 促進要因
- 先進国における好ましい規制シナリオ
- 計画的な妊娠の延期への傾向の高まり
- 新興経済諸国における避妊ニーズの未充足率の高さ
- 性感染症(STD)の蔓延の増加
- 業界の潜在的リスク&課題
- 避妊薬の副作用
- 市場機会
- 長期作用型可逆性避妊薬(LARC)の需要増加
- 非ホルモン性および天然避妊代替品の増加傾向
- 促進要因
- 成長可能性分析
- 規制情勢
- テクノロジーの情勢
- 現在の技術動向
- 新興技術
- 価格分析、2024
- 消費者行動分析
- サプライチェーン分析
- ブランド分析
- トップ企業のビジネスモデル
- クーパーサージカル
- レキット
- 市場参入戦略分析
- ギャップ分析
- ポーター分析
- PESTEL分析
- 将来の市場動向
- バリューチェーン分析
第4章 競合情勢
- イントロダクション
- 企業マトリックス分析
- 企業の市場シェア分析
- グローバル
- 北米
- 欧州
- アジア太平洋地域
- ラテンアメリカ
- 中東・アフリカ
- 競合ポジショニングマトリックス
- 主要市場企業の競合分析
- 主な発展
- 合併と買収
- パートナーシップとコラボレーション
- 新製品の発売
- 拡張計画
第5章 市場推計・予測:製品別、2021-2034
- 主要動向
- デバイス
- コンドーム
- 男性
- 女性
- 子宮内避妊器具
- ホルモン性子宮内避妊器具
- 銅付きIUD
- 膣リング
- 皮下インプラント
- ペッサリー
- 避妊スポンジ
- コンドーム
- 薬物
- 経口避妊薬
- 注入可能な避妊薬
- 話題の避妊薬
第6章 市場推計・予測:年齢別、2021-2034
- 主要動向
- 15~44歳
- 44歳以上
第7章 市場推計・予測:流通チャネル別、2021-2034
- 主要動向
- 小売薬局
- 病院薬局
- オンラインチャネル
- その他の流通チャネル
第8章 市場推計・予測:地域別、2021-2034
- 主要動向
- 北米
- 米国
- カナダ
- 欧州
- ドイツ
- 英国
- フランス
- スペイン
- イタリア
- オランダ
- アジア太平洋地域
- 中国
- 日本
- インド
- オーストラリア
- 韓国
- ラテンアメリカ
- ブラジル
- メキシコ
- アルゼンチン
- 中東・アフリカ
- 南アフリカ
- サウジアラビア
- アラブ首長国連邦
第9章 企業プロファイル
- Agile Therapeutics
- Bayer
- Church &Dwight
- CooperSurgical
- Evofem Biosciences
- Exeltis
- HLL Lifecare(India)
- HRA Pharma/Perrigo(OTC)
- LifeStyles Healthcare
- Mayne Pharma
- Medintim(Kessel)
- Organon
- Pfizer
- Pregna International
- Reckitt
- 発行日
- 発行
- Global Market Insights Inc.
- ページ情報
- 英文 150 Pages
- 納期
- 2~3営業日

