|
|
市場調査レポート
商品コード
1396577
バージ輸送の市場規模:製品別、バージフリート別、用途別、成長見通し、地域別展望、世界予測、2023年~2032年Barge Transportation Market Size - By Product (Dry Cargo, Liquid Cargo, Gaseous Cargo), Barge Fleet (Opened, Covered, Tank Barge), Application, Growth Prospects, Regional Outlook & Global Forecast, 2023 - 2032 |
||||||
|
|
|||||||
カスタマイズ可能
|
|||||||


| バージ輸送の市場規模:製品別、バージフリート別、用途別、成長見通し、地域別展望、世界予測、2023年~2032年 |
|
出版日: 2023年10月16日
発行: Global Market Insights Inc.
ページ情報: 英文 300 Pages
納期: 2~3営業日
|

- 全表示
- 概要
- 図表
- 目次
世界のバージ輸送市場は、2023年から2032年にかけて3%のCAGRを記録すると予想されます。
これは、特にバルク商品と液体貨物におけるバージ輸送の費用対効果と環境に優しい特性によるものです。この輸送手段の効率性は、広範な内陸水路インフラと相まって、持続可能なロジスティクス・ソリューションとしての魅力につながっています。産業界が環境に配慮した慣行を優先し、信頼性が高く経済的な輸送オプションを求める中、これらの要因が組み合わさることで、世界市場におけるバージ輸送の規模と採用が大幅に促進されると思われます。
企業は環境に優しい輸送ソリューションのためにバージを積極的に採用し、持続可能な慣行に貢献しています。この動向は、バージ輸送業界の好転を示しており、環境配慮型物流への顕著なシフトを示しています。例えば、ヴィクトロール社とソジェストラン社の合弁会社であるLNGシッピング社が2023年に就航させた液化天然ガス(LNG)バンカー船、エナジー・ストックホルムは、現在シェルLNG B.V.に傭船されています。二重燃料推進と貨物ボイルオフガスの利用能力を特徴とするこの船は、バッテリー技術と陸上電力を採用し、運航における温室効果ガスの排出を最小限に抑える画期的な動きであり、持続可能な海運慣行における顕著な進歩を意味します。
バージ輸送市場は、製品、用途、地域によって分類されます。
液体貨物部門は、内陸水路を通じて化学品、石油、精製品などの液体を効率的に輸送する上で極めて重要な役割を担っており、2032年までに顕著な市場シェアを獲得するものと思われます。バージ輸送は、費用対効果と環境面で優れているため、液体貨物の輸送に適しています。信頼性が高く持続可能なロジスティクス・ソリューションへの需要が高まる中、液体貨物分野は、産業の多様なニーズを満たす主要な推進力として際立ち、市場の軌道を決定付けると思われます。
石炭と原油のアプリケーション・セグメントによるバージ輸送市場は、水路を利用した石炭と原油の効率的なバルク輸送に対する持続的な需要に牽引され、2032年まで大幅な成長を遂げると思われます。バージ船は、エネルギー・セクターの要件に合致した、コスト効率と環境面で有利なソリューションを提供します。産業界が持続可能なロジスティクスを重視し、これらの商品の信頼できる輸送オプションを求める中、石炭と原油のアプリケーション・セグメントは、バージ輸送市場全体の主要な貢献者として台頭すると思われます。
北米のバージ輸送業界シェアは、2023年から2032年にかけて顕著なCAGRで成長すると予想されるが、これは同地域の広範な内陸水路インフラが効率的な貨物移動を促進していることに起因します。特に米国とカナダでは、バルク貨物の輸送にバージ船が利用されており、市場の成長に大きく貢献すると思われます。費用対効果が高く環境に優しい輸送を重視する北米のバージ船部門は、輸送業界全体の情勢を形成する上で中心的な役割を維持すると思われます。
目次
第1章 調査手法と調査範囲
第2章 エグゼクティブサマリー
第3章 バージ輸送業界考察
- COVID-19の影響
- ロシア・ウクライナ戦争の影響
- エコシステム分析
- ベンダー・マトリックス
- 利益率分析
- バージ船隊と技術革新の状況
- 特許分析
- 主要ニュースとイニシアチブ
- パートナーシップ/コラボレーション
- 合併/買収
- 投資
- 自主性のレベル立ち上げと革新
- 規制状況
- 影響要因
- 促進要因
- 内陸水路に対する政府資金の増加
- 交通渋滞を緩和する必要性の高まり
- 石油化学製品の輸送需要の増加
- 業界の潜在的リスク&課題
- バージ輸送における高い運営費
- 海上輸送に対する政府の厳しい規制
- 促進要因
- 成長可能性分析
- ポーター分析
- PESTEL分析
第4章 競合情勢
- イントロダクション
- 各社の市場シェア
- 主要市場プレーヤーの競合分析
- AT&T Intellectual Property
- Continental AG
- Geotab Inc
- Robert Bosch GmbH
- Sierra Wireless
- TELTONIKA
- TomTom International BV
- Verizon
- 競合のポジショニング・マトリックス
- 戦略展望マトリックス
第5章 バージ輸送市場推計・予測:製品別
- 主要動向:製品別
- 乾燥貨物
- 液体貨物
- 気体貨物
第6章 バージ輸送市場推計・予測:バージフリート別
- 主要動向:バージフリート別
- 開放
- カバー
- タンク船
第7章 バージ輸送市場推計・予測:用途別
- 主要動向:用途別
- 石炭・原油
- 農産物
- コークス及び石油精製品
- 金属鉱石
- 副原料・廃棄物
- 食品、飲食品、タバコ
- 基礎金属、金属加工製品
- 化学品、ゴム・プラスチック、核燃料
- その他
第8章 バージ輸送市場推計・予測:地域別
- 主要動向:地域別
- 北米
- 米国
- カナダ
- 欧州
- 英国
- ドイツ
- フランス
- イタリア
- ロシア
- スペイン
- オランダ
- アジア太平洋
- 中国
- インド
- 日本
- 韓国
- ニュージーランド
- 東南アジア
- ラテンアメリカ
- ブラジル
- メキシコ
- アルゼンチン
- 中東・アフリカ
- UAE
- 南アフリカ
- サウジアラビア
第9章 企業プロファイル
- Alter Logistics Company
- American Commercial Barge Liner(ABCL)
- Argosy international inc
- Blessey Marine Services, Inc.
- Campbell Transportation Company Inc.
- Contargo Waterway Logistics BV
- Heartland Barge
- Ingram Marine Group
- Kirby Corporation
- Marquette Transportation Company LLC.
- McAllister Towing
- Moran Towing Corporation
- Neska Container Line
- Olson Marine Inc.
- Poh Tiong Choon Logistics Ltd
- POSH
- Sause Bros Ocean Towing Co.
- SEACOR HOLDINGS INC.
- Seatac Express Inc.
- Smith Maritime
Data Tables
- TABLE 1 Barge transportation market 360 degree synopsis, 2018-2032
- TABLE 2 Barge transportation market, 2018 - 2022,
- TABLE 3 Barge transportation market, 2023 - 2032,
- TABLE 4 Barge transportation TAM, 2023 - 2032
- TABLE 5 Barge transportation market, by product, 2018 - 2022 (USD Million & Million Tons)
- TABLE 6 Barge transportation market, by product, 2023 - 2032 (USD Million & Million Tons)
- TABLE 7 Barge transportation market, by barge fleet, 2018 - 2022 (USD Million & Million Tons)
- TABLE 8 Barge transportation market, by barge fleet, 2023 - 2032 (USD Million & Million Tons)
- TABLE 9 Barge transportation market, by application, 2018 - 2022 (USD Million & Million Tons)
- TABLE 10 Barge transportation market, by application, 2023 - 2032 (USD Million & Million Tons)
- TABLE 11 COVID-19 impact on the barge transportation market
- TABLE 12 Vendor matrix
- TABLE 13 Patent analysis
- TABLE 14 Industry impact forces
- TABLE 15 Company market share, 2022
- TABLE 16 Competitive analysis of major market players, 2022
- TABLE 17 Dry cargo market, 2018 - 2022 (USD Million & Million Tons)
- TABLE 18 Dry cargo market, 2023 - 2032 (USD Million & Million Tons)
- TABLE 19 Liquid cargo market, 2018 - 2022 (USD Million & Million Tons)
- TABLE 20 Liquid cargo market, 2023 - 2032 (USD Million & Million Tons)
- TABLE 21 Gaseous cargo market, 2018 - 2022 (USD Million & Million Tons)
- TABLE 22 Gaseous cargo market, 2023 - 2032 (USD Million & Million Tons)
- TABLE 23 Opened market, 2018 - 2022 (USD Million & Million Tons)
- TABLE 24 Opened market, 2023 - 2032 (USD Million & Million Tons)
- TABLE 25 Covered market, 2018 - 2022 (USD Million & Million Tons)
- TABLE 26 Covered market, 2023 - 2032 (USD Million & Million Tons)
- TABLE 27 Tank barge market, 2018 - 2022 (USD Million & Million Tons)
- TABLE 28 Tank barge market, 2023 - 2032 (USD Million & Million Tons)
- TABLE 29 Coal and crude petroleum market, 2018 - 2022 (USD Million & Million Tons)
- TABLE 30 Coal and crude petroleum market, 2023 - 2032 (USD Million & Million Tons)
- TABLE 31 Agricultural products market, 2018 - 2022 (USD Million & Million Tons)
- TABLE 32 Agricultural products market, 2023 - 2032 (USD Million & Million Tons)
- TABLE 33 Coke and refined petroleum products market, 2018 - 2022 (USD Million & Million Tons)
- TABLE 34 Coke and refined petroleum products market, 2023 - 2032 (USD Million & Million Tons)
- TABLE 35 Metal ores networks market, 2018 - 2022 (USD Million & Million Tons)
- TABLE 36 Metal ores networks market, 2023 - 2032 (USD Million & Million Tons)
- TABLE 37 Secondary raw material and wastes market, 2018 - 2022 (USD Million & Million Tons)
- TABLE 38 Secondary raw material and wastes market, 2023 - 2032 (USD Million & Million Tons)
- TABLE 39 Food products, beverages, and tobacco market, 2018 - 2022 (USD Million & Million Tons)
- TABLE 40 Food products, beverages, and tobacco market, 2023 - 2032 (USD Million & Million Tons)
- TABLE 41 Basic metals, fabricated metal products market, 2018 - 2022 (USD Million & Million Tons)
- TABLE 42 Basic metals, fabricated metal products networks market, 2023 - 2032 (USD Million & Million Tons)
- TABLE 43 Chemicals, rubber and plastic, nuclear fuel market, 2018 - 2022 (USD Million & Million Tons)
- TABLE 44 Chemicals, rubber and plastic, nuclear fuel market, 2023 - 2032 (USD Million & Million Tons)
- TABLE 45 Others market, 2018 - 2022 (USD Million & Million Tons)
- TABLE 46 Others market, 2023 - 2032 (USD Million & Million Tons)
- TABLE 47 North America barge transportation market, 2018 - 2022 (USD Million & Million Tons)
- TABLE 48 North America barge transportation market, 2023 - 2032 (USD Million & Million Tons)
- TABLE 49 North America barge transportation market, by product, 2018 - 2022 (USD Million & Million Tons)
- TABLE 50 North America barge transportation market, by product, 2023 - 2032 (USD Million & Million Tons)
- TABLE 51 North America barge transportation market, by barge fleet, 2018 - 2022 (USD Million & Million Tons)
- TABLE 52 North America barge transportation market, by barge fleet, 2023 - 2032 (USD Million & Million Tons)
- TABLE 53 North America barge transportation market, by application, 2018 - 2022 (USD Million & Million Tons)
- TABLE 54 North America barge transportation market, by application, 2023 - 2032 (USD Million & Million Tons)
- TABLE 55 U.S. barge transportation market, 2018 - 2022 (USD Million & Million Tons)
- TABLE 56 U.S. barge transportation market, 2023 - 2032 (USD Million & Million Tons)
- TABLE 57 U.S. barge transportation market, by product, 2018 - 2022 (USD Million & Million Tons)
- TABLE 58 U.S. barge transportation market, by product, 2023 - 2032 (USD Million & Million Tons)
- TABLE 59 U.S. barge transportation market, by barge fleet, 2018 - 2022 (USD Million & Million Tons)
- TABLE 60 U.S. barge transportation market, by barge fleet, 2023 - 2032 (USD Million & Million Tons)
- TABLE 61 U.S. barge transportation market, by application, 2018 - 2022 (USD Million & Million Tons)
- TABLE 62 U.S. barge transportation market, by application, 2023 - 2032 (USD Million & Million Tons)
- TABLE 63 Canada barge transportation market, 2018 - 2022 (USD Million & Million Tons)
- TABLE 64 Canada barge transportation market, 2023 - 2032 (USD Million & Million Tons)
- TABLE 65 Canada barge transportation market, by product, 2018 - 2022 (USD Million & Million Tons)
- TABLE 66 Canada barge transportation market, by product, 2023 - 2032 (USD Million & Million Tons)
- TABLE 67 Canada barge transportation market, by barge fleet, 2018 - 2022 (USD Million & Million Tons)
- TABLE 68 Canada barge transportation market, by barge fleet, 2023 - 2032 (USD Million & Million Tons)
- TABLE 69 Canada barge transportation market, by application, 2018 - 2022 (USD Million & Million Tons)
- TABLE 70 Canada barge transportation market, by application, 2023 - 2032 (USD Million & Million Tons)
- TABLE 71 Europe barge transportation market, 2018 - 2022 (USD Million & Million Tons)
- TABLE 72 Europe barge transportation market, 2023 - 2032 (USD Million & Million Tons)
- TABLE 73 Europe barge transportation market, by product, 2018 - 2022 (USD Million & Million Tons)
- TABLE 74 Europe barge transportation market, by product, 2023 - 2032 (USD Million & Million Tons)
- TABLE 75 Europe barge transportation market, by barge fleet, 2018 - 2022 (USD Million & Million Tons)
- TABLE 76 Europe barge transportation market, by barge fleet, 2023 - 2032 (USD Million & Million Tons)
- TABLE 77 Europe barge transportation market, by application, 2018 - 2022 (USD Million & Million Tons)
- TABLE 78 Europe barge transportation market, by application, 2023 - 2032 (USD Million & Million Tons)
- TABLE 79 UK barge transportation market, 2018 - 2022 (USD Million & Million Tons)
- TABLE 80 UK barge transportation market, 2023 - 2032 (USD Million & Million Tons)
- TABLE 81 UK barge transportation market, by product, 2018 - 2022 (USD Million & Million Tons)
- TABLE 82 UK barge transportation market, by product, 2023 - 2032 (USD Million & Million Tons)
- TABLE 83 UK barge transportation market, by barge fleet, 2018 - 2022 (USD Million & Million Tons)
- TABLE 84 UK barge transportation market, by barge fleet, 2023 - 2032 (USD Million & Million Tons)
- TABLE 85 UK barge transportation market, by application, 2018 - 2022 (USD Million & Million Tons)
- TABLE 86 UK barge transportation market, by application, 2023 - 2032 (USD Million & Million Tons)
- TABLE 87 Germany barge transportation market, 2018 - 2022 (USD Million & Million Tons)
- TABLE 88 Germany barge transportation market, 2023 - 2032 (USD Million & Million Tons)
- TABLE 89 Germany barge transportation market, by product, 2018 - 2022 (USD Million & Million Tons)
- TABLE 90 Germany barge transportation market, by product, 2023 - 2032 (USD Million & Million Tons)
- TABLE 91 Germany barge transportation market, by barge fleet, 2018 - 2022 (USD Million & Million Tons)
- TABLE 92 Germany barge transportation market, by barge fleet, 2023 - 2032 (USD Million & Million Tons)
- TABLE 93 Germany barge transportation market, by application, 2018 - 2022 (USD Million & Million Tons)
- TABLE 94 Germany barge transportation market, by application, 2023 - 2032 (USD Million & Million Tons)
- TABLE 95 France barge transportation market, 2018 - 2022 (USD Million & Million Tons)
- TABLE 96 France barge transportation market, 2023 - 2032 (USD Million & Million Tons)
- TABLE 97 France barge transportation market, by product, 2018 - 2022 (USD Million & Million Tons)
- TABLE 98 France barge transportation market, by product, 2023 - 2032 (USD Million & Million Tons)
- TABLE 99 France barge transportation market, by barge fleet, 2018 - 2022 (USD Million & Million Tons)
- TABLE 100 France barge transportation market, by barge fleet, 2023 - 2032 (USD Million & Million Tons)
- TABLE 101 France barge transportation market, by application, 2018 - 2022 (USD Million & Million Tons)
- TABLE 102 France barge transportation market, by application, 2023 - 2032 (USD Million & Million Tons)
- TABLE 103 Italy barge transportation market, 2018 - 2022 (USD Million & Million Tons)
- TABLE 104 Italy barge transportation market, 2023 - 2032 (USD Million & Million Tons)
- TABLE 105 Italy barge transportation market, by product, 2018 - 2022 (USD Million & Million Tons)
- TABLE 106 Italy barge transportation market, by product, 2023 - 2032 (USD Million & Million Tons)
- TABLE 107 Italy barge transportation market, by barge fleet, 2018 - 2022 (USD Million & Million Tons)
- TABLE 108 Italy barge transportation market, by barge fleet, 2023 - 2032 (USD Million & Million Tons)
- TABLE 109 Italy barge transportation market, by application, 2018 - 2022 (USD Million & Million Tons)
- TABLE 110 Italy barge transportation market, by application, 2023 - 2032 (USD Million & Million Tons)
- TABLE 111 Russia barge transportation market, 2018 - 2022 (USD Million & Million Tons)
- TABLE 112 Russia barge transportation market, 2023 - 2032 (USD Million & Million Tons)
- TABLE 113 Russia barge transportation market, by product, 2018 - 2022 (USD Million & Million Tons)
- TABLE 114 Russia barge transportation market, by product, 2023 - 2032 (USD Million & Million Tons)
- TABLE 115 Russia barge transportation market, by barge fleet, 2018 - 2022 (USD Million & Million Tons)
- TABLE 116 Russia barge transportation market, by barge fleet, 2023 - 2032 (USD Million & Million Tons)
- TABLE 117 Russia barge transportation market, by application, 2018 - 2022 (USD Million & Million Tons)
- TABLE 118 Russia barge transportation market, by application, 2023 - 2032 (USD Million & Million Tons)
- TABLE 119 Spain barge transportation market, 2018 - 2022 (USD Million & Million Tons)
- TABLE 120 Spain barge transportation market, 2023 - 2032 (USD Million & Million Tons)
- TABLE 121 Spain barge transportation market, by product, 2018 - 2022 (USD Million & Million Tons)
- TABLE 122 Spain barge transportation market, by product, 2023 - 2032 (USD Million & Million Tons)
- TABLE 123 Spain barge transportation market, by barge fleet, 2018 - 2022 (USD Million & Million Tons)
- TABLE 124 Spain barge transportation market, by barge fleet, 2023 - 2032 (USD Million & Million Tons)
- TABLE 125 Spain barge transportation market, by application, 2018 - 2022 (USD Million & Million Tons)
- TABLE 126 Spain barge transportation market, by application, 2023 - 2032 (USD Million & Million Tons)
- TABLE 127 Netherlands barge transportation market, 2018 - 2022 (USD Million & Million Tons)
- TABLE 128 Netherlands barge transportation market, 2023 - 2032 (USD Million & Million Tons)
- TABLE 129 Netherlands barge transportation market, by product, 2018 - 2022 (USD Million & Million Tons)
- TABLE 130 Netherlands barge transportation market, by product, 2023 - 2032 (USD Million & Million Tons)
- TABLE 131 Netherlands barge transportation market, by barge fleet, 2018 - 2022 (USD Million & Million Tons)
- TABLE 132 Netherlands barge transportation market, by barge fleet, 2023 - 2032 (USD Million & Million Tons)
- TABLE 133 Netherlands barge transportation market, by application, 2018 - 2022 (USD Million & Million Tons)
- TABLE 134 Netherlands barge transportation market, by application, 2023 - 2032 (USD Million & Million Tons)
- TABLE 135 Asia Pacific barge transportation market, 2018 - 2022 (USD Million & Million Tons)
- TABLE 136 Asia Pacific barge transportation market, 2023 - 2032 (USD Million & Million Tons)
- TABLE 137 Asia Pacific barge transportation market, by product, 2018 - 2022 (USD Million & Million Tons)
- TABLE 138 Asia Pacific barge transportation market, by product, 2023 - 2032 (USD Million & Million Tons)
- TABLE 139 Asia Pacific barge transportation market, by barge fleet, 2018 - 2022 (USD Million & Million Tons)
- TABLE 140 Asia Pacific barge transportation market, by barge fleet, 2023 - 2032 (USD Million & Million Tons)
- TABLE 141 Asia Pacific barge transportation market, by application, 2018 - 2022 (USD Million & Million Tons)
- TABLE 142 Asia Pacific barge transportation market, by application, 2023 - 2032 (USD Million & Million Tons)
- TABLE 143 China barge transportation market, 2018 - 2022 (USD Million & Million Tons)
- TABLE 144 China barge transportation market, 2023 - 2032 (USD Million & Million Tons)
- TABLE 145 China barge transportation market, by product, 2018 - 2022 (USD Million & Million Tons)
- TABLE 146 China barge transportation market, by product, 2023 - 2032 (USD Million & Million Tons)
- TABLE 147 China barge transportation market, by barge fleet, 2018 - 2022 (USD Million & Million Tons)
- TABLE 148 China barge transportation market, by barge fleet, 2023 - 2032 (USD Million & Million Tons)
- TABLE 149 China barge transportation market, by application, 2018 - 2022 (USD Million & Million Tons)
- TABLE 150 China barge transportation market, by application, 2023 - 2032 (USD Million & Million Tons)
- TABLE 151 India barge transportation market, 2018 - 2022 (USD Million & Million Tons)
- TABLE 152 India barge transportation market, 2023 - 2032 (USD Million & Million Tons)
- TABLE 153 India barge transportation market, by product, 2018 - 2022 (USD Million & Million Tons)
- TABLE 154 India barge transportation market, by product, 2023 - 2032 (USD Million & Million Tons)
- TABLE 155 India barge transportation market, by barge fleet, 2018 - 2022 (USD Million & Million Tons)
- TABLE 156 India barge transportation market, by barge fleet, 2023 - 2032 (USD Million & Million Tons)
- TABLE 157 India barge transportation market, by application, 2018 - 2022 (USD Million & Million Tons)
- TABLE 158 India barge transportation market, by application, 2023 - 2032 (USD Million & Million Tons)
- TABLE 159 Japan barge transportation market, 2018 - 2022 (USD Million & Million Tons)
- TABLE 160 Japan barge transportation market, 2023 - 2032 (USD Million & Million Tons)
- TABLE 161 Japan barge transportation market, by product, 2018 - 2022 (USD Million & Million Tons)
- TABLE 162 Japan barge transportation market, by product, 2023 - 2032 (USD Million & Million Tons)
- TABLE 163 Japan barge transportation market, by barge fleet, 2018 - 2022 (USD Million & Million Tons)
- TABLE 164 Japan barge transportation market, by barge fleet, 2023 - 2032 (USD Million & Million Tons)
- TABLE 165 Japan barge transportation market, by application, 2018 - 2022 (USD Million & Million Tons)
- TABLE 166 Japan barge transportation market, by application, 2023 - 2032 (USD Million & Million Tons)
- TABLE 167 ANZ barge transportation market, 2018 - 2022 (USD Million & Million Tons)
- TABLE 168 ANZ barge transportation market, 2023 - 2032 (USD Million & Million Tons)
- TABLE 169 ANZ barge transportation market, by product, 2018 - 2022 (USD Million & Million Tons)
- TABLE 170 ANZ barge transportation market, by product, 2023 - 2032 (USD Million & Million Tons)
- TABLE 171 ANZ barge transportation market, by barge fleet, 2018 - 2022 (USD Million & Million Tons)
- TABLE 172 ANZ barge transportation market, by barge fleet, 2023 - 2032 (USD Million & Million Tons)
- TABLE 173 ANZ barge transportation market, by application, 2018 - 2022 (USD Million & Million Tons)
- TABLE 174 ANZ barge transportation market, by application, 2023 - 2032 (USD Million & Million Tons)
- TABLE 175 South Korea barge transportation market, 2018 - 2022 (USD Million & Million Tons)
- TABLE 176 South Korea barge transportation market, 2023 - 2032 (USD Million & Million Tons)
- TABLE 177 South Korea barge transportation market, by product, 2018 - 2022 (USD Million & Million Tons)
- TABLE 178 South Korea barge transportation market, by product, 2023 - 2032 (USD Million & Million Tons)
- TABLE 179 South Korea barge transportation market, by barge fleet, 2018 - 2022 (USD Million & Million Tons)
- TABLE 180 South Korea barge transportation market, by barge fleet, 2023 - 2032 (USD Million & Million Tons)
- TABLE 181 South Korea barge transportation market, by application, 2018 - 2022 (USD Million & Million Tons)
- TABLE 182 South Korea barge transportation market, by application, 2023 - 2032 (USD Million & Million Tons)
- TABLE 183 Southeast Asia barge transportation market, 2018 - 2022 (USD Million & Million Tons)
- TABLE 184 Southeast Asia barge transportation market, 2023 - 2032 (USD Million & Million Tons)
- TABLE 185 Southeast Asia barge transportation market, by product, 2018 - 2022 (USD Million & Million Tons)
- TABLE 186 Southeast Asia barge transportation market, by product, 2023 - 2032 (USD Million & Million Tons)
- TABLE 187 Southeast Asia barge transportation market, by barge fleet, 2018 - 2022 (USD Million & Million Tons)
- TABLE 188 Southeast Asia barge transportation market, by barge fleet, 2023 - 2032 (USD Million & Million Tons)
- TABLE 189 Southeast Asia barge transportation market, by application, 2018 - 2022 (USD Million & Million Tons)
- TABLE 190 Southeast Asia barge transportation market, by application, 2023 - 2032 (USD Million & Million Tons)
- TABLE 191 Latin America barge transportation market, 2018 - 2022 (USD Million & Million Tons)
- TABLE 192 Latin America barge transportation market, 2023 - 2032 (USD Million & Million Tons)
- TABLE 193 Latin America barge transportation market, by product, 2018 - 2022 (USD Million & Million Tons)
- TABLE 194 Latin America barge transportation market, by product, 2023 - 2032 (USD Million & Million Tons)
- TABLE 195 Latin America barge transportation market, by barge fleet, 2018 - 2022 (USD Million & Million Tons)
- TABLE 196 Latin America barge transportation market, by barge fleet, 2023 - 2032 (USD Million & Million Tons)
- TABLE 197 Latin America barge transportation market, by application, 2018 - 2022 (USD Million & Million Tons)
- TABLE 198 Latin America barge transportation market, by application, 2023 - 2032 (USD Million & Million Tons)
- TABLE 199 Brazil barge transportation market, 2018 - 2022 (USD Million & Million Tons)
- TABLE 200 Brazil barge transportation market, 2023 - 2032 (USD Million & Million Tons)
- TABLE 201 Brazil barge transportation market, by product, 2018 - 2022 (USD Million & Million Tons)
- TABLE 202 Brazil barge transportation market, by product, 2023 - 2032 (USD Million & Million Tons)
- TABLE 203 Brazil barge transportation market, by barge fleet, 2018 - 2022 (USD Million & Million Tons)
- TABLE 204 Brazil barge transportation market, by barge fleet, 2023 - 2032 (USD Million & Million Tons)
- TABLE 205 Brazil barge transportation market, by application, 2018 - 2022 (USD Million & Million Tons)
- TABLE 206 Brazil barge transportation market, by application, 2023 - 2032 (USD Million & Million Tons)
- TABLE 207 Mexico barge transportation market, 2018 - 2022 (USD Million & Million Tons)
- TABLE 208 Mexico barge transportation market, 2023 - 2032 (USD Million & Million Tons)
- TABLE 209 Mexico barge transportation market, by product, 2018 - 2022 (USD Million & Million Tons)
- TABLE 210 Mexico barge transportation market, by product, 2023 - 2032 (USD Million & Million Tons)
- TABLE 211 Mexico barge transportation market, by barge fleet, 2018 - 2022 (USD Million & Million Tons)
- TABLE 212 Mexico barge transportation market, by barge fleet, 2023 - 2032 (USD Million & Million Tons)
- TABLE 213 Mexico barge transportation market, by application, 2018 - 2022 (USD Million & Million Tons)
- TABLE 214 Mexico barge transportation market, by application, 2023 - 2032 (USD Million & Million Tons)
- TABLE 215 MEA barge transportation market, 2018 - 2022 (USD Million & Million Tons)
- TABLE 216 MEA barge transportation market, 2023 - 2032 (USD Million & Million Tons)
- TABLE 217 MEA barge transportation market, by product, 2018 - 2022 (USD Million & Million Tons)
- TABLE 218 MEA barge transportation market, by product, 2023 - 2032 (USD Million & Million Tons)
- TABLE 219 MEA barge transportation market, by barge fleet, 2018 - 2022 (USD Million & Million Tons)
- TABLE 220 MEA barge transportation market, by barge fleet, 2023 - 2032 (USD Million & Million Tons)
- TABLE 221 MEA barge transportation market, by application, 2018 - 2022 (USD Million & Million Tons)
- TABLE 222 MEA barge transportation market, by application, 2023 - 2032 (USD Million & Million Tons)
- TABLE 223 UAE barge transportation market, 2018 - 2022 (USD Million & Million Tons)
- TABLE 224 UAE barge transportation market, 2023 - 2032 (USD Million & Million Tons)
- TABLE 225 UAE barge transportation market, by product, 2018 - 2022 (USD Million & Million Tons)
- TABLE 226 UAE barge transportation market, by product, 2023 - 2032 (USD Million & Million Tons)
- TABLE 227 UAE barge transportation market, by barge fleet, 2018 - 2022 (USD Million & Million Tons)
- TABLE 228 UAE barge transportation market, by barge fleet, 2023 - 2032 (USD Million & Million Tons)
- TABLE 229 UAE barge transportation market, by application, 2018 - 2022 (USD Million & Million Tons)
- TABLE 230 UAE barge transportation market, by application, 2023 - 2032 (USD Million & Million Tons)
- TABLE 231 South Africa barge transportation market, 2018 - 2022 (USD Million & Million Tons)
- TABLE 232 South Africa barge transportation market, 2023 - 2032 (USD Million & Million Tons)
- TABLE 233 South Africa barge transportation market, by product, 2018 - 2022 (USD Million & Million Tons)
- TABLE 234 South Africa barge transportation market, by product, 2023 - 2032 (USD Million & Million Tons)
- TABLE 235 South Africa barge transportation market, by barge fleet, 2018 - 2022 (USD Million & Million Tons)
- TABLE 236 South Africa barge transportation market, by barge fleet, 2023 - 2032 (USD Million & Million Tons)
- TABLE 237 South Africa barge transportation market, by application, 2018 - 2022 (USD Million & Million Tons)
- TABLE 238 South Africa barge transportation market, by application, 2023 - 2032 (USD Million & Million Tons)
Charts & Figures
- FIG 1 GMI's report coverage in the barge transportation market
- FIG 2 Industry segmentation
- FIG 3 Forecast calculation
- FIG 4 Profile break-up of primary respondents
- FIG 5 Barge transportation market 36 degree synopsis, 2018 - 2032
- FIG 6 Barge transportation ecosystem analysis
- FIG 7 Profit margin analysis
- FIG 8 Growth potential analysis
- FIG 9 Porter's analysis
- FIG 10 PESTEL analysis
- FIG 11 Competitive analysis of major market players, 2022
- FIG 12 Competitive positioning matrix
- FIG 13 Strategic outlook matrix
- FIG 14 Barge transportation market, by product, 2022 & 2032
- FIG 15 Barge transportation market, by barge fleet, 2022 & 2032
- FIG 16 Barge transportation market, by vehicle, 2022 & 2032
- FIG 17 Barge transportation market, by communication technology, 2022 & 2032
- FIG 18 Barge transportation market, by application, 2022 & 2032
- FIG 19 SWOT Analysis, Alter Logistics Company
- FIG 20 SWOT Analysis, American Commercial Barge Liner (ABCL)
- FIG 21 SWOT Analysis, Argosy international inc
- FIG 22 SWOT Analysis, Blessey Marine Services, Inc.
- FIG 23 SWOT Analysis, Campbell Transportation Company Inc.
- FIG 24 SWOT Analysis, Contargo Waterway Logistics BV
- FIG 25 SWOT Analysis, Heartland Barge
- FIG 26 SWOT Analysis, Ingram Marine Group
- FIG 27 SWOT Analysis, Kirby Corporation
- FIG 28 SWOT Analysis, Marquette Transportation Company LLC.
- FIG 29 SWOT Analysis, McAllister Towing
- FIG 30 SWOT Analysis, Moran Towing Corporation
- FIG 31 SWOT Analysis, Neska Container Line
- FIG 32 SWOT Analysis, Olson Marine Inc.
- FIG 33 SWOT Analysis, Poh Tiong Choon Logistics Ltd
- FIG 34 SWOT Analysis, POSH
- FIG 35 SWOT Analysis, Sause Bros Ocean Towing Co.
- FIG 36 SWOT Analysis, SEACOR HOLDINGS INC.
- FIG 37 SWOT Analysis, Seatac Express Inc.
- FIG 38 SWOT Analysis, Smith Maritime
Global Barge Transportation Market will register a 3% CAGR from 2023 to 2032 owing to the cost-effectiveness and eco-friendly attributes of barge transport, particularly for bulk commodities and liquid cargo. The efficiency of this mode, coupled with extensive inland waterway infrastructure, contributes to its appeal as a sustainable logistics solution. As industries prioritize environmentally conscious practices and seek reliable and economical transport options, the combination of these factors will significantly drive the size and adoption of barge transportation in the global market.
Companies are actively employing barges for eco-friendly transport solutions, contributing to sustainable practices. This trend indicates a positive upturn in the barge transportation industry, marking a prominent shift toward eco-conscious logistics. For instance, in 2023, Energy Stockholm, a liquefied natural gas (LNG) bunker barge launched by LNG Shipping, a Victrol and Sogestran joint venture, is now chartered to Shell LNG B.V. Featuring dual-fuel propulsion and the ability to use cargo boil-off gas, the vessel employs battery technology and shore power, a groundbreaking move to minimize greenhouse gas emissions in its operations, signifying a notable advancement in sustainable shipping practices.
The barge transportation market is classified based on product, application, and region.
The liquid cargo segment will achieve remarkable market share by 2032, fueled by the segment's pivotal role in efficiently transporting liquids such as chemicals, petroleum, and refined products through inland waterways. The cost-effectiveness and environmental advantages of barge transport make it a preferred choice for liquid cargo. With the growing demand for reliable and sustainable logistics solutions, the liquid cargo segment will stand out as a primary driver in meeting the diverse needs of industries, defining the market's trajectory.
The barge transportation market from the coal and crude petroleum application segment will garner substantial gains through 2032, driven by the sustained demand for efficient bulk transportation of coal and crude petroleum via waterways. Barges provide a cost-effective and environmentally favorable solution, aligning with the energy sector's requirements. As industries emphasize sustainable logistics and seek reliable transportation options for these commodities, the coal and crude petroleum application segment will emerge as a key contributor to the overall barge transportation market.
North America barge transportation industry share will grow at a noteworthy CAGR from 2023 to 2032, attributed to the region's extensive inland waterway infrastructure, which facilitates efficient cargo movement. The utilization of barges for transporting bulk goods, particularly in the United States and Canada, will contribute substantially to the market's growth. With an emphasis on cost-effective and environmentally friendly transportation, the barge sector in North America will retain its central role in shaping the overall landscape of the transportation industry.
Table of Contents
Chapter 1 Methodology & Scope
- 1.1 Market scope & definition
- 1.2 Base estimates & calculations
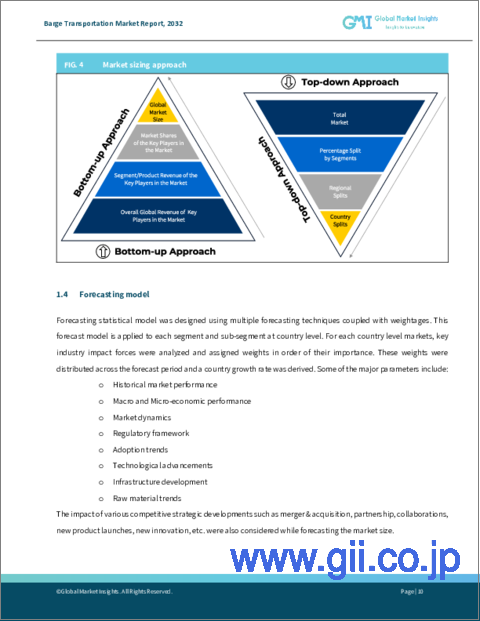
- 1.3 Forecast calculation
- 1.4 Data sources
- 1.4.1 Primary
- 1.4.2 Secondary
- 1.4.2.1 Paid sources
- 1.4.2.2 Public sources
Chapter 2 Executive Summary
- 2.1 Barge transportation market 360 degree synopsis, 2018 - 2032
- 2.2 Business trends
- 2.3 Regional trends
- 2.4 Product trends
- 2.5 Barge fleet trends
- 2.6 Application trends
Chapter 3 Barge Transportation Industry Insights
- 3.1 Impact of COVID-19
- 3.2 Impact of the Russia-Ukraine war
- 3.3 Industry ecosystem analysis
- 3.4 Vendor matrix
- 3.5 Profit margin analysis
- 3.6 Barge fleet & innovation landscape
- 3.7 Patent analysis
- 3.8 Key news and initiatives
- 3.8.1 Partnership/Collaboration
- 3.8.2 Merger/Acquisition
- 3.8.3 Investment
- 3.8.4 Level of autonomy launch & innovation
- 3.9 Regulatory landscape
- 3.10 Impact forces
- 3.10.1 Growth drivers
- 3.10.1.1 Rising government funding for inland waterways
- 3.10.1.2 The rising need to reduce traffic congestion
- 3.10.1.3 Increasing demand for petrochemical shipments
- 3.10.2 Industry pitfalls & challenges
- 3.10.2.1 High operating expenses in barge transportation
- 3.10.2.2 Stringent government regulations on maritime transportation
- 3.10.1 Growth drivers
- 3.11 Growth potential analysis
- 3.12 Porter's analysis
- 3.13 PESTEL analysis
Chapter 4 Competitive Landscape, 2022
- 4.1 Introduction
- 4.2 Company market share, 2022
- 4.3 Competitive analysis of major market players, 2022
- 4.3.1 AT&T Intellectual Property
- 4.3.2 Continental AG
- 4.3.3 Geotab Inc
- 4.3.4 Robert Bosch GmbH
- 4.3.5 Sierra Wireless
- 4.3.6 TELTONIKA
- 4.3.7 TomTom International BV
- 4.3.8 Verizon
- 4.4 Competitive positioning matrix, 2022
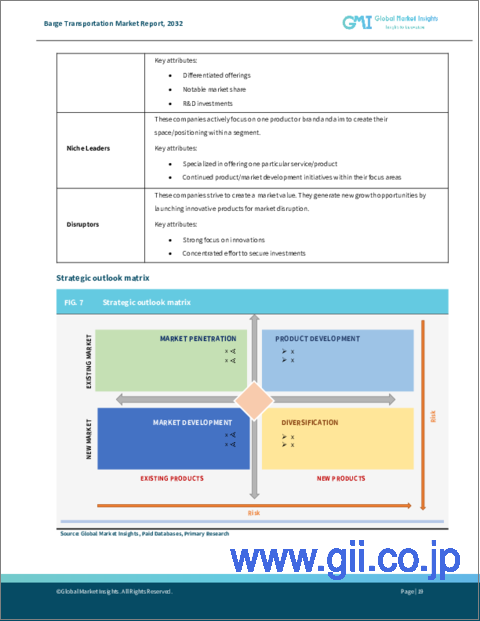
- 4.5 Strategic outlook matrix, 2022
Chapter 5 Barge Transportation Market Estimates & Forecast, By Product (Revenue & Million tons)
- 5.1 Key trends, by product
- 5.2 Dry Cargo
- 5.3 Liquid Cargo
- 5.4 Gaseous Cargo
Chapter 6 Barge Transportation Market Estimates & Forecast, By Barge fleet (Revenue & Million tons)
- 6.1 Key trends, by barge fleet
- 6.2 Opened
- 6.3 Covered
- 6.4 Tank barge
Chapter 7 Barge Transportation Market Estimates & Forecast, By Application (Revenue & Million tons)
- 7.1 Key trends, by application
- 7.2 Coal and Crude petroleum
- 7.3 Agricultural products
- 7.4 Coke and refined petroleum products
- 7.5 Metal ores
- 7.6 Secondary raw material and wastes
- 7.7 Food products, beverages, and tobacco
- 7.8 Basic metals, fabricated metal products
- 7.9 Chemicals, rubber and plastic, nuclear fuel
- 7.10 Others
Chapter 8 Barge Transportation Market Estimates & Forecast, By Region (Revenue & Million tons)
- 8.1 Key trends, by region
- 8.2 North America
- 8.2.1 U.S.
- 8.2.2 Canada
- 8.3 Europe
- 8.3.1 U.K.
- 8.3.2 Germany
- 8.3.3 France
- 8.3.4 Italy
- 8.3.5 Russia
- 8.3.6 Spain
- 8.3.7 Netherlands
- 8.4 Asia Pacific
- 8.4.1 China
- 8.4.2 India
- 8.4.3 Japan
- 8.4.4 South Korea
- 8.4.5 ANZ
- 8.4.6 Southeast Asia
- 8.5 Latin America
- 8.5.1 Brazil
- 8.5.2 Mexico
- 8.5.3 Argentina
- 8.6 MEA
- 8.6.1 UAE
- 8.6.2 South Africa
- 8.6.3 Saudi Arabia
Chapter 9 Company Profiles
- 9.1 Alter Logistics Company
- 9.2 American Commercial Barge Liner (ABCL)
- 9.3 Argosy international inc
- 9.4 Blessey Marine Services, Inc.
- 9.5 Campbell Transportation Company Inc.
- 9.6 Contargo Waterway Logistics BV
- 9.7 Heartland Barge
- 9.8 Ingram Marine Group
- 9.9 Kirby Corporation
- 9.10 Marquette Transportation Company LLC.
- 9.11 McAllister Towing
- 9.12 Moran Towing Corporation
- 9.13 Neska Container Line
- 9.14 Olson Marine Inc.
- 9.15 Poh Tiong Choon Logistics Ltd
- 9.16 POSH
- 9.17 Sause Bros Ocean Towing Co.
- 9.18 SEACOR HOLDINGS INC.
- 9.19 Seatac Express Inc.
- 9.20 Smith Maritime
