
|
市場調査レポート
商品コード
1667135
ホップ市場の機会、成長促進要因、産業動向分析、2025~2034年の予測Hops Market Opportunity, Growth Drivers, Industry Trend Analysis, and Forecast 2025 - 2034 |
||||||
カスタマイズ可能
|
|||||||
| ホップ市場の機会、成長促進要因、産業動向分析、2025~2034年の予測 |
|
出版日: 2024年12月27日
発行: Global Market Insights Inc.
ページ情報: 英文 235 Pages
納期: 2~3営業日
|

全表示
- 概要
- 目次
世界のホップ市場は2024年に88億米ドルとなり、2025年から2034年にかけてCAGR 6.1%で成長すると予測されています。
多様なビールスタイル、特に風味と香りのためにホップをふんだんに使ったビールスタイルへの需要の増加が、市場の主な促進要因となっています。ビール醸造業者は、革新的で風味豊かなビールを作るために独自のホップ品種を調達するようになっており、幅広い選択肢の必要性を煽っています。ホップの栽培、育種、加工における技術革新もまた、市場成長の推進に重要な役割を果たしています。研究開発では、独特の風味を持ち、病気に対する耐性を向上させた新規ホップ品種の創出に注力しています。持続可能な農業技術と、化粧品や医薬品などの産業におけるホップの用途拡大が、さらに新たな成長の道を開いています。これらの要因が相まって、消費者の嗜好の変化や産業界の需要に対応した高品質のホップの安定供給が確保されています。
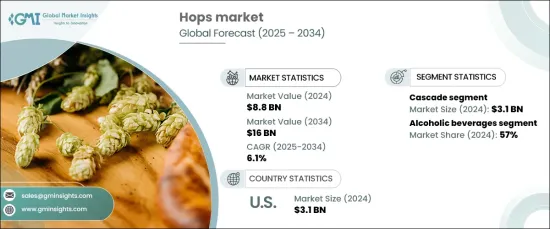
製品セグメンテーションの観点から、ホップ市場はカスケード、チヌーク、アマリロ、センテニアル、その他など様々なタイプに分類されます。カスケードが市場で大きなシェアを占め、2024年には31億米ドルの売上を生み出します。その広範な人気は、ビールを生き生きとした独特の風味で引き立てるその能力に起因しており、複雑で魅力的な飲料を作るために不可欠な原料となっています。この多用途性により、醸造業者の間で好まれる選択肢としての地位を確固たるものにしています。
| 市場範囲 | |
|---|---|
| 開始年 | 2024 |
| 予測年 | 2025-2034 |
| 開始金額 | 88億米ドル |
| 予測金額 | 160億米ドル |
| CAGR | 6.1% |
ホップ市場の用途には、アルコール飲料、医薬品、化粧品、その他の分野があります。2024年のシェアはアルコール飲料が57%と圧倒的です。ホップは、麦芽の甘味を補完し、風味、苦味、香りを提供することで、ビールのバランスの取れた味を作り出す上で重要な役割を果たしています。これらは、ラガー、スタウト、エール、特殊ビールなど、さまざまな飲料に幅広く利用されています。ユニークで大胆な風味を求める継続的な需要が、飲料業界におけるホップの採用拡大に寄与しています。
米国のホップ市場は、クラフトビール産業の隆盛とプレミアム品質のビールへの嗜好の高まりにより、2024年には31億米ドルの評価額に達しました。特にホップ生産で知られる地域では、理想的な気候条件と先進的な農法が市場のダイナミクスをさらに高めています。持続可能な有機農法の台頭も、高品質の原料を求める消費者ニーズと合致し、業界にさらなる勢いをもたらしています。これらの要因から、米国は世界のホップ市場の主要プレーヤーとして位置づけられており、今後も持続的な成長が見込まれます。
目次
第1章 調査手法と調査範囲
- 市場範囲と定義
- 基本推定と計算
- 予測計算
- データソース
- 1次データ
- 2次データ
- 有料情報源
- 公的情報源
第2章 エグゼクティブサマリー
第3章 業界洞察
- エコシステム分析
- バリューチェーンに影響を与える要因
- 利益率分析
- 破壊
- 将来の展望
- メーカー
- 流通業者
- サプライヤーの状況
- 利益率分析
- 主要ニュースと取り組み
- 規制状況
- 影響要因
- 促進要因
- クラフトビール人気の高まり
- 地ビール産業の拡大
- ユニークなフレーバーへの需要の高まり
- 業界の潜在的リスク&課題
- 代替品との競合
- 生産コストの上昇
- 促進要因
- 成長可能性分析
- ポーターの分析
- PESTEL分析
第4章 競合情勢
- イントロダクション
- 企業シェア分析
- 競合のポジショニング・マトリックス
- 戦略展望マトリックス
第5章 市場推計・予測:タイプ別、2021年~2034年
- 主要動向
- カスケード
- チヌーク
- アマリロ
- センテニアル
- その他(例:シトラ、ギャラクシー、シムコー)
第6章 市場推計・予測:用途別、2021年~2034年
- 主要動向
- アルコール飲料
- 医薬品
- 化粧品
- その他
第7章 市場推計・予測:地域別、2021年~2034年
- 主要動向
- 北米
- 米国
- カナダ
- 欧州
- 英国
- ドイツ
- フランス
- イタリア
- スペイン
- ロシア
- アジア太平洋
- 中国
- インド
- 日本
- 韓国
- オーストラリア
- ラテンアメリカ
- ブラジル
- メキシコ
- 中東・アフリカ
- 南アフリカ
- サウジアラビア
- アラブ首長国連邦
第8章 企業プロファイル
- Ausmauco Biotech
- Barth-Haas Group
- Brewers Select Limited
- Carlsberg Breweries
- DVKSP Impex
- Heineken
- Hop Head Farms
- Hops Direct
- John I. Haas
- New Zealand Hops
- Sapporo Holdings
- Steiner Hops
- Styrian Hops
- The Hop Planter Association Tettnang
- Yakima Chief Hops
The Global Hops Market was valued at USD 8.8 billion in 2024 and is projected to grow at a CAGR of 6.1% from 2025 to 2034. The increasing demand for diverse beer styles, particularly those enriched with hops for flavor and aroma, is a major driver of the market. Brewers are increasingly sourcing unique hop varieties to craft innovative and flavorful beers, fueling the need for a wider range of options. Innovation in hop cultivation, breeding, and processing is also playing a critical role in propelling market growth, as research and development efforts focus on creating novel hop types with distinctive taste profiles and improved resistance to diseases. Sustainable farming techniques and expanding applications for hops in industries such as cosmetics and pharmaceuticals further open new growth avenues. These factors collectively ensure a consistent supply of high-quality hops, catering to the evolving preferences of consumers and industrial demands.
In terms of product segmentation, the hops market is categorized into various types, including cascade, chinook, amarillo, centennial, and others. Cascade accounted for a significant share of the market, generating a revenue of USD 3.1 billion in 2024. Its widespread popularity stems from its ability to enhance beers with vibrant, unique flavors, making it an essential ingredient for crafting complex and appealing beverages. This versatility has solidified its position as a favored choice among brewers.
| Market Scope | |
|---|---|
| Start Year | 2024 |
| Forecast Year | 2025-2034 |
| Start Value | $8.8 Billion |
| Forecast Value | $16 Billion |
| CAGR | 6.1% |
The application landscape of the hops market includes alcoholic beverages, pharmaceuticals, cosmetics, and other segments. Alcoholic beverages dominated the market with a commanding 57% share in 2024. Hops play a crucial role in creating a balanced taste in beers by providing flavor, bitterness, and aroma, complementing the sweetness of malt. They are extensively utilized in a variety of beverages, including lagers, stouts, ales, and specialty brews. The continued demand for unique and bold flavor profiles contributes to the growing adoption of hops in the beverage industry.
The US hops market reached a valuation of USD 3.1 billion in 2024, driven by a thriving craft beer industry and a growing preference for premium-quality brews. Ideal climatic conditions and advanced farming practices, particularly in regions known for their hop production, further enhance market dynamics. The rise of sustainable and organic farming practices also aligns with consumer demands for high-quality ingredients, providing additional momentum to the industry. These factors position the US as a key player in the global hops market, ensuring sustained growth in the years ahead.
Table of Contents
Chapter 1 Methodology & Scope
- 1.1 Market scope & definitions
- 1.2 Base estimates & calculations
- 1.3 Forecast calculations
- 1.4 Data sources
- 1.4.1 Primary
- 1.4.2 Secondary
- 1.4.2.1 Paid sources
- 1.4.2.2 Public sources
Chapter 2 Executive Summary
- 2.1 Industry synopsis, 2021-2034
Chapter 3 Industry Insights
- 3.1 Industry ecosystem analysis
- 3.1.1 Factor affecting the value chain
- 3.1.2 Profit margin analysis
- 3.1.3 Disruptions
- 3.1.4 Future outlook
- 3.1.5 Manufacturers
- 3.1.6 Distributors
- 3.2 Supplier landscape
- 3.3 Profit margin analysis
- 3.4 Key news & initiatives
- 3.5 Regulatory landscape
- 3.6 Impact forces
- 3.6.1 Growth drivers
- 3.6.1.1 Increasing popularity of craft beer
- 3.6.1.2 Expanding microbrewery industry
- 3.6.1.3 Increasing demand for unique flavors
- 3.6.2 Industry pitfalls & challenges
- 3.6.2.1 Competition from substitutes
- 3.6.2.2 Rising production costs
- 3.6.1 Growth drivers
- 3.7 Growth potential analysis
- 3.8 Porter’s analysis
- 3.9 PESTEL analysis
Chapter 4 Competitive Landscape, 2024
- 4.1 Introduction
- 4.2 Company market share analysis
- 4.3 Competitive positioning matrix
- 4.4 Strategic outlook matrix
Chapter 5 Market Estimates & Forecast, By Type, 2021-2034 (USD Billion) (Kilo Tons)
- 5.1 Key trends
- 5.2 Cascade
- 5.3 Chinook
- 5.4 Amarillo
- 5.5 Centennial
- 5.6 Others (e.g., citra, galaxy, simcoe)
Chapter 6 Market Estimates & Forecast, By Application, 2021-2034 (USD Billion) (Kilo Tons)
- 6.1 Key trends
- 6.2 Alcoholic beverages
- 6.3 Pharmaceuticals
- 6.4 Cosmetics
- 6.5 Others
Chapter 7 Market Estimates & Forecast, By Region, 2021-2034 (USD Billion) (Kilo Tons)
- 7.1 Key trends
- 7.2 North America
- 7.2.1 U.S.
- 7.2.2 Canada
- 7.3 Europe
- 7.3.1 UK
- 7.3.2 Germany
- 7.3.3 France
- 7.3.4 Italy
- 7.3.5 Spain
- 7.3.6 Russia
- 7.4 Asia Pacific
- 7.4.1 China
- 7.4.2 India
- 7.4.3 Japan
- 7.4.4 South Korea
- 7.4.5 Australia
- 7.5 Latin America
- 7.5.1 Brazil
- 7.5.2 Mexico
- 7.6 MEA
- 7.6.1 South Africa
- 7.6.2 Saudi Arabia
- 7.6.3 UAE
Chapter 8 Company Profiles
- 8.1 Ausmauco Biotech
- 8.2 Barth-Haas Group
- 8.3 Brewers Select Limited
- 8.4 Carlsberg Breweries
- 8.5 DVKSP Impex
- 8.6 Heineken
- 8.7 Hop Head Farms
- 8.8 Hops Direct
- 8.9 John I. Haas
- 8.10 New Zealand Hops
- 8.11 Sapporo Holdings
- 8.12 Steiner Hops
- 8.13 Styrian Hops
- 8.14 The Hop Planter Association Tettnang
- 8.15 Yakima Chief Hops

