
|
市場調査レポート
商品コード
1666714
空気分離ユニットの市場機会、成長促進要因、産業動向分析、2025年~2034年予測Air Separation Unit Market Opportunity, Growth Drivers, Industry Trend Analysis, and Forecast 2025 - 2034 |
||||||
カスタマイズ可能
|
|||||||
| 空気分離ユニットの市場機会、成長促進要因、産業動向分析、2025年~2034年予測 |
|
出版日: 2024年12月31日
発行: Global Market Insights Inc.
ページ情報: 英文 120 Pages
納期: 2~3営業日
|

全表示
- 概要
- 目次
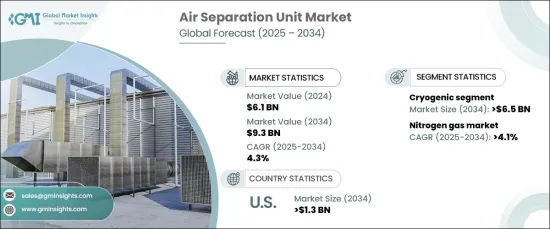
世界の空気分離ユニット市場は、2024年に61億米ドルとなり、2025年から2034年にかけて4.3%の安定したCAGRで成長すると予測されています。
この成長の原動力は、産業ガス需要の増加、技術の進歩、さまざまな部門における持続可能な実践の重視です。産業の拡大と、よりクリーンなエネルギーソリューションへのシフトは、酸素や窒素などのガスの必要性をさらに高め、ASUの需要を強化しています。
強化された極低温プロセスや自動化の統合などの技術革新が、より効率的でコスト効率の高い空気分離ソリューションの開発を促進しています。エネルギー効率が高くコンパクトな設計に重点を置くことで、エネルギー使用量と運転経費を最小限に抑えるという業界の目標に沿ったモジュール式ASUへの道が開かれました。このような進歩は、環境責任を優先しながらプロセスの合理化を目指す産業に対応しています。
| 市場範囲 | |
|---|---|
| 開始年 | 2024年 |
| 予測年 | 2025年~2034年 |
| 開始金額 | 61億米ドル |
| 予測金額 | 93億米ドル |
| CAGR | 4.3% |
極低温空気分離ユニット分野は、高純度ガスに対する産業ニーズの高まりに支えられ、2034年までに65億米ドルを突破する見通しです。これらのユニットは、多様な用途でますます利用されるようになっており、特定のガス要件を満たすためにカスタマイズされたソリューションを提供しています。優れたガス純度を提供する極低温ASUの能力により、多くの産業プロセスに不可欠なものとなっています。
多くの用途で重要な成分である窒素は、2034年までのCAGRが4.1%を超えると予測されています。製造、食品加工、エレクトロニクスなどの分野での使用量の増加が、この動向の主要な推進力となっています。ASUは、さまざまな純度レベルの窒素に対応できるように進化しており、独自の仕様を持つ業界に柔軟性を提供しています。この適応性により、産業界がガス生産と供給にどのように取り組むかが再構築されつつあります。
米国では、ASU市場は2034年までに13億米ドルを超えると予想されています。二酸化炭素排出量の削減と厳格な環境規制の遵守への注目が高まっていることが、業界の軌道に大きな影響を与えています。ASUは、よりクリーンな生産プロセスを可能にし、産業ガスの安定供給を保証することで、この移行をサポートする重要な役割を果たしています。さらに、ヘルスケア環境における信頼性の高いガスシステムへの需要、特に高純度酸素への需要が、市場の成長に寄与しています。
目次
第1章 調査手法と調査範囲
- 市場範囲と定義
- 市場推計・予測パラメータ
- 予測計算
- データソース
- 一次
- 二次
- 有料
- 公的
第2章 エグゼクティブサマリー
第3章 業界洞察
- 業界エコシステム分析
- 規制状況
- 業界への影響要因
- 成長促進要因
- 業界の潜在的リスク・課題
- 成長ポテンシャル分析
- ポーター分析
- 供給企業の交渉力
- 買い手の交渉力
- 新規参入業者の脅威
- 代替品の脅威
- PESTEL分析
第4章 競合情勢
- イントロダクション
- 戦略的展望
- イノベーションと持続可能性の展望
第5章 市場規模・予測:プロセス別、2021年~2034年
- 主要動向
- 極低温
- 非極低温
第6章 市場規模・予測:ガス別、2021年~2034年
- 主要動向
- 窒素
- 酸素
- アルゴン
- その他
第7章 市場規模・予測:最終用途別、2021~2034年
- 主要動向
- 鉄鋼
- 石油・ガス
- ヘルスケア
- 化学
- その他
第8章 市場規模・予測:地域別、2021年~2034年
- 主要動向
- 北米
- 米国
- カナダ
- 欧州
- ドイツ
- フランス
- 英国
- スペイン
- イタリア
- アジア太平洋
- 中国
- インド
- 日本
- オーストラリア
- 韓国
- 中東・アフリカ
- サウジアラビア
- アラブ首長国連邦
- 南アフリカ
- ラテンアメリカ
- ブラジル
- アルゼンチン
第9章 企業プロファイル
- Air Liquide
- Air Products and Chemicals
- Cryotec Anlagenbau
- Kaifeng Air Separation Group
- Linde
- Messer
- Praxair Technology
- Ranch Cryogenics
- Sichuan Air Separation Plant Group
- Taiyo Nippon Sanso
- Universal Industrial Gases
- Yingde Gases
The Global Air Separation Unit Market, valued at USD 6.1 billion in 2024, is projected to grow at a steady CAGR of 4.3% from 2025 to 2034. This growth is fueled by the rising demand for industrial gases, technological advancements, and a strong emphasis on sustainable practices across various sectors. Expanding industries and the shift toward cleaner energy solutions have further amplified the need for gases such as oxygen and nitrogen, bolstering the demand for ASUs.
Innovations in technology, including enhanced cryogenic processes and the integration of automation, are driving the development of more efficient and cost-effective air separation solutions. The focus on energy-efficient and compact designs has paved the way for modular ASUs that align with industry goals to minimize energy usage and operational expenses. These advancements cater to industries aiming to streamline processes while prioritizing environmental responsibility.
| Market Scope | |
|---|---|
| Start Year | 2024 |
| Forecast Year | 2025-2034 |
| Start Value | $6.1 Billion |
| Forecast Value | $9.3 Billion |
| CAGR | 4.3% |
The cryogenic air separation unit segment is poised to surpass USD 6.5 billion by 2034, supported by the growing industrial need for high-purity gases. These units are increasingly utilized in diverse applications, offering tailored solutions to meet specific gas requirements. The ability of cryogenic ASUs to deliver superior gas purity makes them indispensable for numerous industrial processes.
Nitrogen, a critical component for many applications, is anticipated to experience a CAGR of over 4.1% through 2034. Rising usage in sectors like manufacturing, food processing, and electronics is a key driver of this trend. ASUs are evolving to accommodate varying purity levels of nitrogen, providing flexibility for industries with unique specifications. This adaptability is reshaping how industries approach gas production and supply.
In the United States, the ASU market is expected to exceed USD 1.3 billion by 2034. The increasing focus on reducing carbon emissions and adhering to stringent environmental regulations is significantly influencing the industry's trajectory. ASUs play a vital role in supporting this transition by enabling cleaner production processes and ensuring a consistent supply of industrial gases. Moreover, the demand for reliable gas systems in healthcare settings, particularly for high-purity oxygen, is contributing to market growth.
Table of Contents
Chapter 1 Methodology & Scope
- 1.1 Market scope & definitions
- 1.2 Market estimates & forecast parameters
- 1.3 Forecast calculation
- 1.4 Data sources
- 1.4.1 Primary
- 1.4.2 Secondary
- 1.4.2.1 Paid
- 1.4.2.2 Public
Chapter 2 Executive Summary
- 2.1 Industry synopsis, 2021 - 2034
Chapter 3 Industry Insights
- 3.1 Industry ecosystem analysis
- 3.2 Regulatory landscape
- 3.3 Industry impact forces
- 3.3.1 Growth drivers
- 3.3.2 Industry pitfalls & challenges
- 3.4 Growth potential analysis
- 3.5 Porter's analysis
- 3.5.1 Bargaining power of suppliers
- 3.5.2 Bargaining power of buyers
- 3.5.3 Threat of new entrants
- 3.5.4 Threat of substitutes
- 3.6 PESTEL analysis
Chapter 4 Competitive Landscape, 2024
- 4.1 Introduction
- 4.2 Strategic outlook
- 4.3 Innovation & sustainability landscape
Chapter 5 Market Size and Forecast, By Process, 2021 – 2034 (USD Billion)
- 5.1 Key trends
- 5.2 Cryogenic
- 5.3 Non-Cryogenic
Chapter 6 Market Size and Forecast, By Gas, 2021 – 2034 (USD Billion)
- 6.1 Key trends
- 6.2 Nitrogen
- 6.3 Oxygen
- 6.4 Argon
- 6.5 Others
Chapter 7 Market Size and Forecast, By End Use, 2021 – 2034 (USD Billion)
- 7.1 Key trends
- 7.2 Iron & steel
- 7.3 Oil & gas
- 7.4 Healthcare
- 7.5 Chemicals
- 7.6 Others
Chapter 8 Market Size and Forecast, By Region, 2021 – 2034 (USD Billion)
- 8.1 Key trends
- 8.2 North America
- 8.2.1 U.S.
- 8.2.2 Canada
- 8.3 Europe
- 8.3.1 Germany
- 8.3.2 France
- 8.3.3 UK
- 8.3.4 Spain
- 8.3.5 Italy
- 8.4 Asia Pacific
- 8.4.1 China
- 8.4.2 India
- 8.4.3 Japan
- 8.4.4 Australia
- 8.4.5 South Korea
- 8.5 Middle East & Africa
- 8.5.1 Saudi Arabia
- 8.5.2 UAE
- 8.5.3 South Africa
- 8.6 Latin America
- 8.6.1 Brazil
- 8.6.2 Argentina
Chapter 9 Company Profiles
- 9.1 Air Liquide
- 9.2 Air Products and Chemicals
- 9.3 Cryotec Anlagenbau
- 9.4 Kaifeng Air Separation Group
- 9.5 Linde
- 9.6 Messer
- 9.7 Praxair Technology
- 9.8 Ranch Cryogenics
- 9.9 Sichuan Air Separation Plant Group
- 9.10 Taiyo Nippon Sanso
- 9.11 Universal Industrial Gases
- 9.12 Yingde Gases

