
資産管理市場の機会、成長促進要因、産業動向分析、2025年~2034年の予測
Asset Management Market Opportunity, Growth Drivers, Industry Trend Analysis, and Forecast 2025 - 2034- 発行日
- ページ情報
- 英文 180 Pages
- 納期
- 2~3営業日
- 商品コード
- 1685229
- カスタマイズ可能 お客様のご希望に応じて、既存データの加工や未掲載情報(例:国別セグメント)の追加などの対応が可能です。詳細はお問い合わせください。
- 翻訳ツール提供対象 PDF対応AI翻訳ツールの無料貸し出しサービスのご利用が可能です
概要
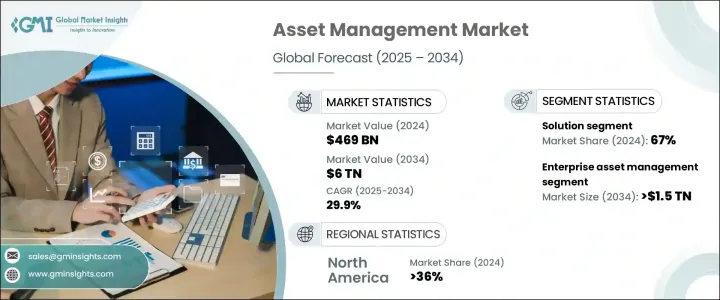
世界の資産管理市場は、2024年には4,690億米ドルとなり、2025年から2034年にかけてのCAGRは29.9%と予測され、大幅な成長が見込まれています。
この顕著な拡大は、業界全体における業務効率化、コスト削減、意思決定能力の強化に対する要求の高まりが原動力となっています。企業がオペレーションの最適化、投資収益率の向上、効果的なコスト管理といったプレッシャーに直面するにつれ、高度な資産管理ソリューションが成功のために不可欠となっています。資産の取得、維持、アップグレードにかかるコストの上昇により、資産管理システムは単なる必需品ではなく、長期的な事業持続のための戦略的ツールとなっています。これらのソリューションは、企業が物理的な資産のライフサイクルを最適化し、リアルタイムでパフォーマンスを監視し、より効率的にメンテナンスをスケジュールすることを支援します。
製造業、エネルギー、公益事業、運輸、鉱業などの業界では、複雑な資産ポートフォリオを管理する必要性が高まっており、市場の成長をさらに後押ししています。これらの分野が世界的に拡大し続ける中、機械、インフラ、設備などの物理的資産の管理はかつてないほど困難になっています。これらの業界の企業は、パフォーマンスを向上させ、ダウンタイムを削減し、円滑な運営と投資収益の最大化を図るため、資産管理に大きく依存しています。資産管理テクノロジーは、資産パフォーマンスとライフサイクル管理の複雑さを乗り切る上で特に有益であり、競争力を維持し、卓越したオペレーションを達成する上で不可欠となっています。
| 市場範囲 | |
|---|---|
| 開始年 | 2024 |
| 予測年 | 2025-2034 |
| 開始金額 | 4,690億米ドル |
| 予測金額 | 6兆ドル |
| CAGR | 29.9% |
市場は用途別にヘルスケア資産管理、インフラ資産管理、企業資産管理(EAM)、航空資産管理、その他に区分されます。企業資産管理(EAM)分野は2024年に32%のシェアで市場をリードし、2034年には1兆5,000億米ドルを生み出すと予測されています。EAMソリューションは、取得から設置、メンテナンス、交換に至るまで、資産ライフサイクルの最適化を目指す企業にとって不可欠です。これらのシステムにより、企業は資産のライフサイクルの各段階を追跡することができ、リソースの割り当てやメンテナンス・スケジュールについて十分な情報に基づいた意思決定を行うことができます。
コンポーネント別に見ると、市場はソリューションとサービスに分けられます。2024年のシェアは、ソリューション部門が67%と圧倒的です。この分野は、資産の多い業界のニーズに対応する統合ツールや技術の必要性によって、急速な成長を遂げています。資産管理ソリューションは、リアルタイム追跡、メンテナンス・スケジューリング、予測分析、在庫管理などの機能を提供します。これらの機能により、企業は業務を合理化し、ダウンタイムを削減し、資産効率を最大化することができるため、さまざまな分野でこれらのソリューションの採用が進んでいます。
北米は、2024年時点で世界の資産管理市場の36%という大きなシェアを占めています。製造業、エネルギー、公益事業、インフラストラクチャーなどの主要部門が資産集約型業務に依存しており、同地域の強固な産業プレゼンスが市場成長に大きく貢献しています。厳しい規制基準を満たし、運用パフォーマンスを向上させる必要性から、予知保全、IoT対応システム、リアルタイムの資産モニタリングといった革新的なソリューションへの需要が高まり続けています。
目次
第1章 調査手法と調査範囲
- 調査デザイン
- 調査コンポーネント
- データ収集方法
- 基本推定と計算
- 基準年の算出
- 市場予測の主要動向
- 予測モデル
- 1次調査と検証
- 一次情報
- データマイニングソース
- 市場定義
第2章 エグゼクティブサマリー
第3章 業界洞察
- エコシステム分析
- サプライヤーの状況
- ソリューションプロバイダー
- ハードウェアプロバイダー
- IoTとセンサーのプロバイダー
- クラウド・プロバイダー
- エンドユーザー
- 利益率分析
- テクノロジーとイノベーションの展望
- 主要ニュースとイニシアチブ
- 規制状況
- 影響要因
- 促進要因
- 拡大するデジタルトランスフォーメーションとインダストリー4.0
- 業務効率化とコスト削減の重視
- 遠隔地およびデジタル資産管理への需要の高まり
- 持続可能性と規制遵守
- 資産集約型産業の成長
- 業界の潜在的リスク&課題
- 既存システムとの統合の複雑さ
- データプライバシーとセキュリティへの懸念
- 促進要因
- 成長可能性分析
- ポーター分析
- PESTEL分析
第4章 競合情勢
- イントロダクション
- 企業シェア分析
- 競合のポジショニング・マトリックス
- 戦略展望マトリックス
第5章 市場推計・予測:コンポーネント別、2021年~2034年
- 主要動向
- ソリューション
- リアルタイムロケーションシステム(RTLS)
- バーコード
- モバイルコンピューター
- ラベル
- 全地球測位システム(GPS)
- その他
- サービス
- 戦略的資産管理
- 運用資産管理
- 戦術的資産管理
第6章 市場推計・予測:機能別、2021年~2034年
- 主要動向
- 位置・移動追跡
- チェックイン/チェックアウト
- 修理・メンテナンス
- その他
第7章 市場推計・予測:資産別、2021年~2034年
- 主要動向
- デジタル資産
- リターナブル輸送資産
- 輸送中資産
- 製造資産
- 人員/スタッフ
第8章 市場推計・予測:用途別、2021年~2034年
- 主要動向
- インフラ
- 輸送
- エネルギーインフラ
- 水・廃棄物インフラ
- 重要インフラ
- その他
- 企業
- ヘルスケア
- 航空
- その他
第9章 市場推計・予測:地域別、2021年~2034年
- 主要動向
- 北米
- 米国
- カナダ
- 欧州
- 英国
- ドイツ
- フランス
- スペイン
- イタリア
- ロシア
- 北欧
- アジア太平洋
- 中国
- インド
- 日本
- 韓国
- ニュージーランド
- 東南アジア
- ラテンアメリカ
- ブラジル
- メキシコ
- アルゼンチン
- 中東・アフリカ
- UAE
- 南アフリカ
- サウジアラビア
第10章 企業プロファイル
- ABB
- Adobe
- Bentley Systems
- Brookfield Asset Management
- CGI Group
- Cisco
- General Electric
- Hexagon
- Hitachi
- Honeywell
- IBM
- Johnson Controls
- Oracle
- Rockwell Automation
- SAP SE
- Schneider Electric
- Siemens
- Wipro
- WSP Global
- Zebra Technologies
目次
The Global Asset Management Market, valued at USD 469 billion in 2024, is expected to experience substantial growth, with a projected CAGR of 29.9% between 2025 and 2034. This remarkable expansion is driven by increasing demands for operational efficiency, cost reductions, and enhanced decision-making capabilities across industries. As businesses face growing pressure to optimize operations, enhance returns on investments, and manage costs effectively, advanced asset management solutions are becoming critical for success. The rising cost of acquiring, maintaining, and upgrading assets makes asset management systems not just a necessity but a strategic tool for long-term business sustainability. These solutions help companies optimize their physical asset lifecycles, monitor performance in real-time, and schedule maintenance more efficiently, all while minimizing operational disruptions.
The growing need for managing complex asset portfolios in industries like manufacturing, energy, utilities, transportation, and mining is further propelling market growth. As these sectors continue to expand globally, managing physical assets such as machinery, infrastructure, and equipment has never been more challenging. Businesses in these industries rely heavily on asset management to improve performance and reduce downtime, ensuring smooth operations and maximizing returns on their investments. Asset management technologies are particularly beneficial in navigating the intricacies of asset performance and lifecycle management, which have become vital to staying competitive and achieving operational excellence.
| Market Scope | |
|---|---|
| Start Year | 2024 |
| Forecast Year | 2025-2034 |
| Start Value | $469 Billion |
| Forecast Value | $6 Trillion |
| CAGR | 29.9% |
The market is segmented by application into healthcare asset management, infrastructure asset management, enterprise asset management (EAM), aviation asset management, and others. The enterprise asset management (EAM) segment led the market in 2024 with a 32% share and is projected to generate USD 1.5 trillion by 2034. EAM solutions are essential for businesses looking to optimize asset lifecycles, from acquisition and installation to maintenance and replacement. These systems allow businesses to keep track of each stage of an asset's life, enabling them to make informed decisions on resource allocation and maintenance schedules.
In terms of components, the market is divided into solutions and services. The solutions segment represented a dominant 67% share in 2024. This segment is experiencing rapid growth, driven by the need for integrated tools and technologies that address the needs of asset-heavy industries. Asset management solutions offer features like real-time tracking, maintenance scheduling, predictive analytics, and inventory management. These features enable organizations to streamline operations, reduce downtime, and maximize asset efficiency, driving the adoption of these solutions across various sectors.
North America holds a significant 36% share of the global asset management market as of 2024. The region's robust industrial presence, with major sectors such as manufacturing, energy, utilities, and infrastructure relying on asset-intensive operations, contributes significantly to market growth. The demand for innovative solutions like predictive maintenance, IoT-enabled systems, and real-time asset monitoring continues to rise, driven by the need to meet stringent regulatory standards and improve operational performance.
Table of Contents
Chapter 1 Methodology & Scope
- 1.1 Research design
- 1.1.1 Research Component
- 1.1.2 Data collection methods
- 1.2 Base estimates and calculations
- 1.2.1 Base year calculation
- 1.2.2 Key trends for market estimates
- 1.3 Forecast model
- 1.4 Primary research & validation
- 1.4.1 Primary sources
- 1.4.2 Data mining sources
- 1.5 Market definitions
Chapter 2 Executive Summary
- 2.1 Industry 360º synopsis, 2021 - 2034
Chapter 3 Industry Insights
- 3.1 Industry ecosystem analysis
- 3.2 Supplier landscape
- 3.2.1 Solution providers
- 3.2.2 Hardware providers
- 3.2.3 IoT and sensor providers
- 3.2.4 Cloud providers
- 3.2.5 End users
- 3.3 Profit margin analysis
- 3.4 Technology & innovation landscape
- 3.5 Key news & initiatives
- 3.6 Regulatory landscape
- 3.7 Impact forces
- 3.7.1 Growth drivers
- 3.7.1.1 Growing digital transformation and Industry 4.0
- 3.7.1.2 Focus on operational efficiency and cost reduction
- 3.7.1.3 Rise in demand for remote and digital asset management
- 3.7.1.4 Sustainability and regulatory compliance
- 3.7.1.5 Growth of asset-intensive industries
- 3.7.2 Industry pitfalls & challenges
- 3.7.2.1 Complexity of integration with existing systems
- 3.7.2.2 Data privacy and security concerns
- 3.7.1 Growth drivers
- 3.8 Growth potential analysis
- 3.9 Porter’s analysis
- 3.10 PESTEL analysis
Chapter 4 Competitive Landscape, 2024
- 4.1 Introduction
- 4.2 Company market share analysis
- 4.3 Competitive positioning matrix
- 4.4 Strategic outlook matrix
Chapter 5 Market Estimates & Forecast, By Component, 2021 - 2034 ($Bn)
- 5.1 Key trends
- 5.2 Solution
- 5.2.1 Real-Time Location System (RTLS)
- 5.2.2 Barcode
- 5.2.3 Mobile computer
- 5.2.4 Labels
- 5.2.5 Global Positioning System (GPS)
- 5.2.6 Others
- 5.3 Service
- 5.3.1 Strategic asset management
- 5.3.2 Operational asset management
- 5.3.3 Tactical asset management
Chapter 6 Market Estimates & Forecast, By Function, 2021 - 2034 ($Bn)
- 6.1 Key trends
- 6.2 Location & movement tracking
- 6.3 Check In/ check out
- 6.4 Repair & maintenance
- 6.5 Others
Chapter 7 Market Estimates & Forecast, By Asset, 2021 - 2034 ($Bn)
- 7.1 Key trends
- 7.2 Digital assets
- 7.3 Returnable transport assets
- 7.4 In-transit assets
- 7.5 Manufacturing assets
- 7.6 Personnel/ staff
Chapter 8 Market Estimates & Forecast, By Application, 2021 - 2034 ($Bn)
- 8.1 Key trends
- 8.2 Infrastructure
- 8.2.1 Transportation
- 8.2.2 Energy infrastructure
- 8.2.3 Water & waste infrastructure
- 8.2.4 Critical infrastructure
- 8.2.5 Others
- 8.3 Enterprise
- 8.4 Healthcare
- 8.5 Aviation
- 8.6 Others
Chapter 9 Market Estimates & Forecast, By Region, 2021 - 2034 ($Bn)
- 9.1 Key trends
- 9.2 North America
- 9.2.1 U.S.
- 9.2.2 Canada
- 9.3 Europe
- 9.3.1 UK
- 9.3.2 Germany
- 9.3.3 France
- 9.3.4 Spain
- 9.3.5 Italy
- 9.3.6 Russia
- 9.3.7 Nordics
- 9.4 Asia Pacific
- 9.4.1 China
- 9.4.2 India
- 9.4.3 Japan
- 9.4.4 South Korea
- 9.4.5 ANZ
- 9.4.6 Southeast Asia
- 9.5 Latin America
- 9.5.1 Brazil
- 9.5.2 Mexico
- 9.5.3 Argentina
- 9.6 MEA
- 9.6.1 UAE
- 9.6.2 South Africa
- 9.6.3 Saudi Arabia
Chapter 10 Company Profiles
- 10.1 ABB
- 10.2 Adobe
- 10.3 Bentley Systems
- 10.4 Brookfield Asset Management
- 10.5 CGI Group
- 10.6 Cisco
- 10.7 General Electric
- 10.8 Hexagon
- 10.9 Hitachi
- 10.10 Honeywell
- 10.11 IBM
- 10.12 Johnson Controls
- 10.13 Oracle
- 10.14 Rockwell Automation
- 10.15 SAP SE
- 10.16 Schneider Electric
- 10.17 Siemens
- 10.18 Wipro
- 10.19 WSP Global
- 10.20 Zebra Technologies
- 発行日
- 発行
- Global Market Insights Inc.
- ページ情報
- 英文 180 Pages
- 納期
- 2~3営業日