
|
市場調査レポート
商品コード
1685137
固定分路リアクトル市場の機会、成長促進要因、産業動向分析、2025年~2034年の予測Fixed Shunt Reactor Market Opportunity, Growth Drivers, Industry Trend Analysis, and Forecast 2025 - 2034 |
||||||
カスタマイズ可能
|
|||||||
| 固定分路リアクトル市場の機会、成長促進要因、産業動向分析、2025年~2034年の予測 |
|
出版日: 2025年01月09日
発行: Global Market Insights Inc.
ページ情報: 英文 120 Pages
納期: 2~3営業日
|

全表示
- 概要
- 目次
世界の固定分路リアクトル市場は、2024年に13億米ドルと評価され、2025年から2034年にかけてCAGR 6.1%の安定した成長が見込まれています。
この成長は、特に風力や太陽光のような再生可能エネルギー源の既存電力システムへの統合が進むにつれて、送電網の安定性と電力品質の改善に対する需要が高まっていることに大きく起因しています。再生可能エネルギーが変動するにつれて、無効電力の管理と電圧安定性の維持が難しくなり、固定分路リアクトルへの依存度が高まっています。これらのデバイスは、送電網の性能向上、トランスミッション損失の低減、電圧不安定性の防止に役立ち、これらはすべて電力網の効率的な運用に不可欠です。材料やデジタル・モニタリング・システムの技術的進歩がリアクトルの効率をさらに高め、市場拡大の強力な基盤となっています。また、世界的に電力インフラの近代化が進んでいることに加え、より持続可能なエネルギー慣行を求める規制の後押しも市場を後押ししています。
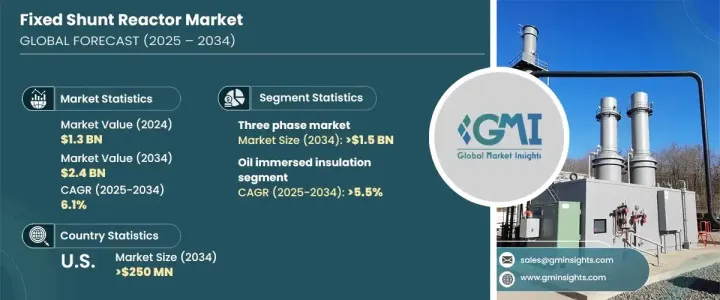
三相固定分路リアクトル分野は、大容量送電網の安定化に不可欠な役割を果たすことから、2034年までに15億米ドルに達すると予測されています。これらのリアクトルは、より大きな負荷を管理し、高電圧トランスミッションの電圧安定性を維持するために必要な無効電力補償を提供するのに特に効果的です。リアクトルの設計の進歩により、効率はさらに向上し、メンテナンスの頻度も減り、時間の経過とともに信頼性も高まっています。このため、三相リアクトルは産業、都市、トランスミッションのアプリケーション、特に再生可能エネルギーの統合が進んでいる地域で好まれる選択肢となっています。大規模な送電網運用に対応するリアクトルの能力は、その信頼性と相まって、これらの地域での魅力をさらに高めています。
| 市場範囲 | |
|---|---|
| 開始年 | 2024 |
| 予測年 | 2025-2034 |
| 開始金額 | 13億米ドル |
| 予測金額 | 24億米ドル |
| CAGR | 6.1% |
固定分路リアクトル市場内の油浸絶縁セグメントは、2034年まで5.5%の堅調な成長率が見込まれます。これは、リアクトルのエネルギー効率、信頼性、寿命を向上させる絶縁材料の技術革新が進んでいることに起因しています。オイル断熱システムは、その優れた放熱特性が特に評価されており、性能が重要視される高需要環境に適しています。一方、コンパクトな設計でメンテナンスの必要性が低く、環境に優しいことで知られる空芯炉も人気を集めています。どちらの絶縁技術も先進的な材料開発の恩恵を受けており、固定分路リアクトルが効率と持続可能性に対する業界の要求を満たし続けることを保証しています。
米国の固定分路リアクトル市場は、2034年までに2億5,000万米ドルを生み出すと予測されています。この力強い成長には、老朽化した電力インフラの近代化、再生可能エネルギー源への広範な移行など、いくつかの要因が寄与しています。クリーンエネルギーの推進とスマートグリッド技術の発展を目指す米国政府の取り組みが、これらのリアクトルの需要をさらに拡大しています。さらに、原子炉の設計と断熱材の改善により、より高い信頼性と性能を備えた原子炉が誕生し、電力部門全体への幅広い導入が促されています。エネルギー情勢が進化する中、このような技術的アップグレードにより、固定分路リアクトルがグリッド管理における重要なコンポーネントであり続けることが保証されます。
目次
第1章 調査手法と調査範囲
- 市場の定義
- 基本推定と計算
- 予測計算
- データソース
- 1次データ
- 二次データ
- 有償
- 公的
第2章 エグゼクティブサマリー
第3章 業界洞察
- エコシステム分析
- 規制状況
- 業界への影響要因
- 促進要因
- 業界の潜在的リスク&課題
- 成長ポテンシャル分析
- ポーター分析
- PESTEL分析
第4章 競合情勢
- 戦略ダッシュボード
- イノベーションと持続可能性の展望
第5章 市場規模・予測:フェーズ別、2021年~2034年
- 主要動向
- 単相
- 三相
第6章 市場規模・予測:インシュレーション別、2021~2034年
- 主要動向
- 油浸
- 空芯
第7章 市場規模・予測:最終用途別、2021年~2034年
- 主要動向
- 電気事業
- 再生可能エネルギー
第8章 市場規模・予測:地域別、2021年~2034年
- 主要動向
- 北米
- 米国
- カナダ
- 欧州
- 英国
- ドイツ
- フランス
- イタリア
- ロシア
- アジア太平洋
- 中国
- インド
- 日本
- オーストラリア
- 中東・アフリカ
- サウジアラビア
- アラブ首長国連邦
- カタール
- 南アフリカ
- ラテンアメリカ
- ブラジル
- アルゼンチン
第9章 企業プロファイル
- CG Power &Industrial Solutions
- Fuji Electric
- GBE
- GE
- GETRA
- Hitachi Energy
- Hyosung Heavy Industries
- Nissin Electric
- SGB SMIT
- Shrihans Electricals
- Siemens Energy
- TMC Transformers
- Toshiba Energy Systems &Solutions
- WEG
The Global Fixed Shunt Reactor Market was valued at USD 1.3 billion in 2024 and is anticipated to experience a steady growth rate of 6.1% CAGR from 2025 to 2034. This growth can be largely attributed to the increasing demand for grid stability and improved power quality, especially with the rising integration of renewable energy sources like wind and solar into existing power systems. As renewable energy fluctuates, managing reactive power and maintaining voltage stability is becoming more challenging, leading to a growing reliance on fixed shunt reactors. These devices help improve grid performance, reduce transmission losses, and prevent voltage instability, which are all essential for the efficient operation of power networks. Technological advancements in materials and digital monitoring systems are further enhancing reactor efficiency, offering a strong foundation for market expansion. The market is also being fueled by the ongoing modernization of power infrastructure worldwide, along with the regulatory push for more sustainable energy practices.
The three-phase fixed shunt reactor segment is projected to reach USD 1.5 billion by 2034, driven by its essential role in stabilizing high-capacity electrical grids. These reactors are particularly effective at managing larger loads and providing the reactive power compensation needed to maintain voltage stability in high-voltage transmission networks. The advancement of reactor design has made them even more efficient, requiring less maintenance and becoming more reliable over time. This makes three-phase reactors the preferred choice for industrial, urban, and transmission applications, particularly in regions that are increasing their renewable energy integration. The reactors' ability to handle large-scale grid operations, combined with their reliability, further boosts their appeal in these areas.
| Market Scope | |
|---|---|
| Start Year | 2024 |
| Forecast Year | 2025-2034 |
| Start Value | $1.3 Billion |
| Forecast Value | $2.4 Billion |
| CAGR | 6.1% |
The oil-immersed insulation segment within the fixed shunt reactor market is expected to see a solid growth rate of 5.5% through 2034. This can be attributed to ongoing innovations in insulation materials that enhance the energy efficiency, reliability, and lifespan of reactors. Oil insulation systems are especially valued for their excellent heat dissipation properties, making them suitable for high-demand environments where performance is critical. On the other hand, air-core reactors, known for their compact design, lower maintenance needs, and environmentally friendly nature, are also gaining popularity. Both insulation technologies are benefiting from advanced material development, ensuring that fixed shunt reactors continue to meet industry demands for efficiency and sustainability.
The U.S. fixed shunt reactor market is projected to generate USD 250 million by 2034. Several factors are contributing to this robust growth, including the modernization of aging power infrastructure and the widespread transition toward renewable energy sources. U.S. government initiatives aimed at promoting clean energy and advancing smart grid technologies further amplify the demand for these reactors. Moreover, improvements in reactor designs and insulation materials have resulted in reactors that offer greater reliability and performance, encouraging broader adoption throughout the power sector. As the energy landscape evolves, these technological upgrades ensure that fixed shunt reactors remain a key component in grid management.
Table of Contents
Chapter 1 Methodology & Scope
- 1.1 Market definitions
- 1.2 Base estimates & calculations
- 1.3 Forecast calculation
- 1.4 Data sources
- 1.4.1 Primary
- 1.4.2 Secondary
- 1.4.2.1 Paid
- 1.4.2.2 Public
Chapter 2 Executive Summary
- 2.1 Industry synopsis, 2021 - 2034
Chapter 3 Industry Insights
- 3.1 Industry ecosystem analysis
- 3.2 Regulatory landscape
- 3.3 Industry impact forces
- 3.3.1 Growth drivers
- 3.3.2 Industry pitfalls & challenges
- 3.4 Growth potential analysis
- 3.5 Porter's analysis
- 3.5.1 Bargaining power of suppliers
- 3.5.2 Bargaining power of buyers
- 3.5.3 Threat of new entrants
- 3.5.4 Threat of substitutes
- 3.6 PESTEL analysis
Chapter 4 Competitive Landscape, 2024
- 4.1 Strategic dashboard
- 4.2 Innovation & sustainability landscape
Chapter 5 Market Size and Forecast, By Phase, 2021 – 2034 (USD Million)
- 5.1 Key trends
- 5.2 Single phase
- 5.3 Three phase
Chapter 6 Market Size and Forecast, By Insulation, 2021 – 2034 (USD Million)
- 6.1 Key trends
- 6.2 Oil immersed
- 6.3 Air core
Chapter 7 Market Size and Forecast, By End Use, 2021 – 2034 (USD Million)
- 7.1 Key trends
- 7.2 Electric utility
- 7.3 Renewable energy
Chapter 8 Market Size and Forecast, By Region, 2021 – 2034 (USD Million)
- 8.1 Key trends
- 8.2 North America
- 8.2.1 U.S.
- 8.2.2 Canada
- 8.3 Europe
- 8.3.1 UK
- 8.3.2 Germany
- 8.3.3 France
- 8.3.4 Italy
- 8.3.5 Russia
- 8.4 Asia Pacific
- 8.4.1 China
- 8.4.2 India
- 8.4.3 Japan
- 8.4.4 Australia
- 8.5 Middle East & Africa
- 8.5.1 Saudi Arabia
- 8.5.2 UAE
- 8.5.3 Qatar
- 8.5.4 South Africa
- 8.6 Latin America
- 8.6.1 Brazil
- 8.6.2 Argentina
Chapter 9 Company Profiles
- 9.1 CG Power & Industrial Solutions
- 9.2 Fuji Electric
- 9.3 GBE
- 9.4 GE
- 9.5 GETRA
- 9.6 Hitachi Energy
- 9.7 Hyosung Heavy Industries
- 9.8 Nissin Electric
- 9.9 SGB SMIT
- 9.10 Shrihans Electricals
- 9.11 Siemens Energy
- 9.12 TMC Transformers
- 9.13 Toshiba Energy Systems & Solutions
- 9.14 WEG

