
|
市場調査レポート
商品コード
1858988
マネージドネットワークサービスの市場機会、成長促進要因、産業動向分析、2025年~2034年予測Managed Network Services Market Opportunity, Growth Drivers, Industry Trend Analysis, and Forecast 2025 - 2034 |
||||||
カスタマイズ可能
|
|||||||
| マネージドネットワークサービスの市場機会、成長促進要因、産業動向分析、2025年~2034年予測 |
|
出版日: 2025年10月14日
発行: Global Market Insights Inc.
ページ情報: 英文 230 Pages
納期: 2~3営業日
|

概要
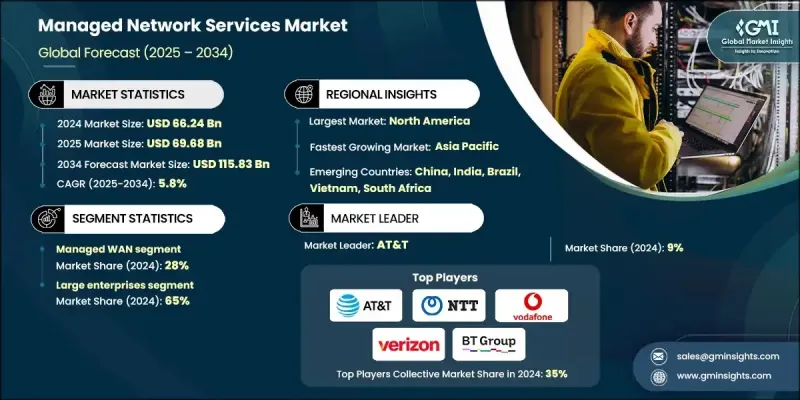
マネージドネットワークサービスの世界市場規模は、2024年に662億4,000万米ドルとなり、CAGR 5.8%で成長し、2034年には1,158億3,000万米ドルに達すると予測されています。
同市場は、ネットワーク・インフラストラクチャの簡素化と安全性の確保を目指す企業にとって不可欠なものとなっています。複雑なネットワークを管理するために社内チームを維持するよりも、スケーラブルで効率的かつセキュアなソリューションを提供するサービスプロバイダにアウトソーシングする企業が増えています。Software-Definedネットワーキング・モデルへの移行は、業界全体の急速なデジタル変革とともに、この成長に大きな役割を果たしています。今日の企業は、地理的に分散した拠点、データセンター、クラウドプラットフォームにまたがる柔軟でインテリジェントな接続オプションを要求しています。クラウドの採用とリモートワークの増加が続く中、企業は運用を合理化し、運用負担を軽減するマネージド・サービスを選ぶようになっています。ネットワーク・アーキテクチャにAI、自動化、統合セキュリティを組み込むことで、マネージド・サービス・プロバイダーは、コストを最適化しながらパフォーマンスを強化する企業を支援しています。
| 市場範囲 | |
|---|---|
| 開始年 | 2024 |
| 予測年 | 2025-2034 |
| 市場規模 | 662億4,000万米ドル |
| 予測金額 | 1,158億3,000万米ドル |
| CAGR | 5.8% |
マネージドWAN分野は2024年に28%のシェアを占め、2034年までのCAGRは6.4%で成長すると予測されています。WANソリューションは、データセンター、リモートオフィス、クラウドリソースを結ぶ上で重要な役割を果たしています。企業がグローバルに拡大し、クラウドベースのアプリケーションへの依存度が高まるにつれ、堅牢でスケーラブル、かつセキュアなWANネットワークに対する需要は増加の一途をたどっています。SD-WANのような進化するテクノロジーは、トラフィック管理を改善し、パフォーマンスを向上させコストを削減するアプリケーション認識ルーティングを提供することで、採用をさらに促進しています。
2024年現在、大企業セグメントのシェアは65%で、2034年までのCAGRは5.9%と予想されています。これらの企業は通常、グローバルなオフィス、従業員、インフラをつなぐ広大で複雑なネットワークを運用しています。このような複雑さを社内で管理するには多大な投資と専門知識が必要であり、これが大企業がマネージドサービスプロバイダーを利用する理由です。マネージドWANやSD-WANのようなソリューションは、一元化された可視性、拡張性、合理化された制御を提供し、ダイナミックな運用環境を持つ企業にとって極めて重要な機能です。
北米マネージドネットワークサービス市場は2024年に33%のシェアを占め、219億1,000万米ドルを創出しました。同地域は、確立されたデジタルエコシステム、広範なエンタープライズテクノロジーの導入、強力なサービスプロバイダーの存在によって利益を得ています。IBM、シスコシステムズ、ベライゾン、AT&Tなどの公開会社は、自動化、AI主導のアナリティクス、クラウドネイティブツールで継続的にサービスを強化しており、金融、ヘルスケア、物流、公共部門などの業界が次世代ネットワークインフラで優位に立てるよう支援しています。このような環境は、高度なネットワーク・アウトソーシング・モデルの繁栄を可能にし、北米のリーダーシップをさらに強化します。
世界のマネージドネットワークサービス市場で事業を展開する主要企業には、シスコシステムズ、ルーメン、ベライゾン、ボーダフォン、IBM、T-システムズ、オレンジ、BT、AT&T、PCCW、NTTなどがあります。マネージドネットワークサービス市場でより強固な足場を確保するため、各社は統合サービスの提供、AI主導の自動化、クラウドファーストのアーキテクチャに注力しています。サービスプロバイダーは、SD-WAN、マネージドセキュリティ、ハイブリッドクラウドネットワーキングを含むポートフォリオを拡大し、ソリューションを現代の企業の需要に合わせています。クラウドプロバイダーやデータセンター事業者との戦略的パートナーシップは、ネットワークの拡張とサービス提供の改善に役立っています。また、企業はインテリジェントな分析プラットフォームに投資し、プロアクティブなネットワーク監視、予測メンテナンス、パフォーマンス最適化を実現しています。
よくあるご質問
目次
第1章 調査手法
- 調査デザイン
- 調査アプローチ
- データ収集方法
- 基本推定と計算
- 基準年の計算
- 市場推計の主要動向
- GMI独自のAIシステム
- AIによる調査強化
- ソース一貫性プロトコル
- AI精度メトリクス
- 予測モデル
- 1次調査と検証
- 市場推計の主要動向
- 定量化された市場影響分析
- 成長パラメータが予測に与える数学的影響
- シナリオ分析フレームワーク
- 一次情報の一部(これらに限定されない)
- データマイニングソース
- 2次データ
- 有料情報源
- 公開情報源
- 地域別情報源
- 2次データ
- リサーチトレイルと信頼性スコアリング
- リサーチトレイルの構成要素:
- スコアリングコンポーネント
- 調査の透明性に関する補遺
- 情報源帰属の枠組み
- 品質保証指標
- 信頼へのコミットメント
第2章 エグゼクティブサマリー
第3章 業界考察
- エコシステム分析
- サプライヤーの情勢
- 利益率分析
- コスト構造
- 各段階での付加価値
- バリューチェーンに影響を与える要因
- ディスラプション
- 業界への影響要因
- 促進要因
- 信頼性が高くセキュアなネットワークへの需要の高まり
- クラウドサービスの採用増加
- IoTとコネクテッドデバイスの拡大
- コスト効率と予算の最適化
- 増加するサイバー脅威と規制への対応
- リモートワークとハイブリッドワークフォースの動向
- 業界の潜在的リスク&課題
- サードパーティプロバイダーへの高い依存度
- データプライバシーとセキュリティへの懸念
- 市場機会
- 5Gネットワーク拡張
- 中小企業における需要の高まり
- AIとオートメーションの統合
- エッジコンピューティングの台頭
- 促進要因
- 成長可能性分析
- ビジネスケース分析
- ROI計算モデルと投資回収期間分析
- リスク評価と軽減戦略
- パフォーマンス指標
- チェンジマネジメントと組織の準備
- 今後の市場展望
- テクノロジーコンバージェンスロードマップ
- 次世代サービスモデル
- インダストリー4.0統合とデジタルツインネットワーキング
- 持続可能性への取り組みとカーボンニュートラル・ネットワーキング
- 投資機会と市場参入戦略
- リスク評価とシナリオプランニング
- 新たな市場機会と未開拓セグメント
- ベンダー選定ガイドと導入フレームワーク
- 包括的なベンダー評価手法
- 契約交渉戦略
- チェンジマネジメントとスタッフトレーニングの要件
- パフォーマンスモニタリングと継続的改善
- 出口戦略立案とベンダー移行管理
- 特許分析
- 規制情勢
- テクノロジーとイノベーションの展望
- 現在の技術動向
- 新興テクノロジー
- 価格動向
- 地域別
- 製品別
- コスト内訳分析
- 総所有コスト(TCO)分析
- ポーター分析
- PESTEL分析
- 投資・資金動向分析
- サービスレベル契約(SLA)のベンチマークとペナルティ分析
- AIとオートメーション統合の影響評価
- 持続可能性と環境側面
- 持続可能な実践
- 廃棄物削減戦略
- 生産におけるエネルギー効率
- 環境にやさしい取り組み
- カーボンフットプリント
第4章 競合情勢
- イントロダクション
- 企業の市場シェア分析
- 北米
- 欧州
- アジア太平洋地域
- ラテンアメリカ
- 中東・アフリカ
- 主要市場企業の競合分析
- 競合ポジショニングマトリックス
- 戦略的展望マトリックス
- 技術革新と研究開発投資分析
- 市場参入戦略
- 顧客満足度ベンチマーキング
- 主な発展
- 合併・買収
- パートナーシップと提携
- 新製品発表
- 拡張計画と資金調達
第5章 市場推計・予測サービス別、2021-2034
- 主要動向
- マネージドLAN
- マネージドVPN
- マネージドWAN
- マネージドWi-Fi
- マネージドセキュリティ
- マネージド・モニタリング
- その他
第6章 市場推計・予測展開モード別、2021-2034
- 主要動向
- 構内
- クラウド
第7章 市場推計・予測組織規模別、2021-2034
- 主要動向
- 中小企業(SMEs)
- 大企業
第8章 市場推計・予測:最終用途産業別、2021-2034
- 主要動向
- BFSI
- IT・通信
- 小売・eコマース
- ヘルスケア
- 製造業
- 政府・公共事業
- メディア&エンターテインメント
- 教育
- その他
第9章 市場推計・予測:地域別、2021-2034
- 主要動向
- 北米
- 米国
- カナダ
- 欧州
- ドイツ
- 英国
- フランス
- イタリア
- スペイン
- 北欧諸国
- ロシア
- アジア太平洋地域
- 中国
- インド
- 日本
- オーストラリア
- インドネシア
- フィリピン
- タイ
- 韓国
- シンガポール
- ラテンアメリカ
- ブラジル
- メキシコ
- アルゼンチン
- 中東・アフリカ
- サウジアラビア
- 南アフリカ
- アラブ首長国連邦
第10章 企業プロファイル
- グローバルプレーヤー
- Cisco Systems
- International Business Machines(IBM)
- Accenture
- Microsoft
- Amazon Web Services(AWS)
- Verizon Communications
- AT&T
- Hewlett Packard Enterprise(HPE)
- NTT
- Dell Technologies
- 地域プレーヤー
- BT
- Orange Business Services
- Deutsche Telekom
- Tata Communications
- TELUS
- Telefonica Tech
- SoftBank
- China Telecom
- Singtel
- Etisalat
- 新興プレーヤー/ 破壊者
- Aryaka Networks
- Cato Networks
- Zscaler
- Windstream Enterprise
- GTT Communications

