
|
市場調査レポート
商品コード
1684773
充電式薄膜電池市場の機会、成長促進要因、産業動向分析、2025~2034年予測Rechargeable Thin Film Battery Market Opportunity, Growth Drivers, Industry Trend Analysis, and Forecast 2025 - 2034 |
||||||
カスタマイズ可能
|
|||||||
| 充電式薄膜電池市場の機会、成長促進要因、産業動向分析、2025~2034年予測 |
|
出版日: 2025年01月15日
発行: Global Market Insights Inc.
ページ情報: 英文 110 Pages
納期: 2~3営業日
|

全表示
- 概要
- 目次
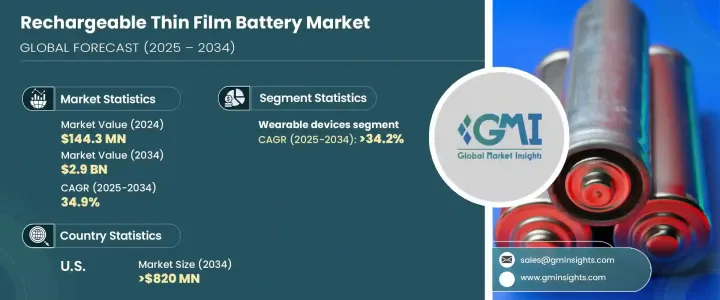
充電式薄膜電池の世界市場は、2024年に1億4,430万米ドルと評価され、2025年から2034年にかけて34.9%のCAGRで著しい成長が見込まれています。
この成長の主な要因は、幅広い産業において、コンパクトで効率的かつ信頼性の高いエネルギー貯蔵ソリューションに対する需要が高まっていることです。薄膜電池は、小型、軽量設計、長期のライフサイクルにわたって安定した性能を発揮する能力など、独自の長所により支持を集めています。これらの特徴は、特に医療技術、ウェアラブル、スマートカードなどの分野における携帯機器への応用に理想的です。
モノのインターネット(IoT)の急速な拡大は、省スペースで信頼性の高いエネルギー源の必要性をさらに煽り、薄膜電池メーカーに大きなビジネスチャンスをもたらしています。さらに、エネルギー密度、安全性、持続可能性の向上といった電池技術の進歩が、これらの電池の魅力を高めています。環境に優しく高性能なエネルギー・ソリューションを優先する産業が増えるにつれ、薄膜電池は好ましい選択肢として浮上しています。市場は研究開発への投資も拡大しており、これが技術革新を加速し、これらの先進エネルギー貯蔵システムの採用を促進しています。
| 市場範囲 | |
|---|---|
| 開始年 | 2024 |
| 予測年 | 2025-2034 |
| 開始金額 | 1億4,430万米ドル |
| 予測金額 | 29億米ドル |
| CAGR | 34.9% |
ウェアラブル技術分野は、充電式薄膜電池市場の成長の主な要因になると予想され、2034年までの需要のCAGRは34.2%で成長すると予測されます。薄膜電池は、高エネルギー密度、コンパクトなフォームファクター、高速充電機能により、ウェアラブル機器に特に適しています。これらの特性により、メーカーは、スマートウォッチ、フィットネストラッカー、健康モニタリングガジェットなど、小型化され、美的に魅力的なデバイスを設計することができ、効率が向上し、電池寿命が長くなります。ウェアラブル技術に対する消費者の需要が高まり続ける中、薄膜電池は革新的で耐久性のある製品の開発に不可欠な要素になりつつあります。ウェアラブル産業の厳しい要件を満たすその能力は、この分野の成長を実現する重要な要素となっています。
米国の充電式薄膜電池市場は、先端エレクトロニクス、ウェアラブル、医療機器における小型エネルギー貯蔵ソリューションの需要増に牽引され、2034年までに8億2,000万米ドルを創出すると予測されています。電池設計、特にエネルギー密度と安全性における革新は、米国メーカーにこれらの分野の進化するニーズに応える最先端の電池を生産する力を与えています。IoT機器、スマートカード、次世代医療用インプラントの採用が拡大していることも、市場拡大にさらに貢献しています。さらに、持続可能で環境に優しい技術への注目が、固体薄膜電池へのシフトを加速させています。科学研究者とテクノロジー企業のコラボレーションは、こうしたエネルギー貯蔵ソリューションの開発と商業化を進める上で極めて重要な役割を果たしています。このような取り組みにより、米国は世界の充電式薄膜電池市場のリーダーとしての地位を確立し、急速に進化する市場における競争力を確保しています。
目次
第1章 調査手法と調査範囲
- 市場の定義
- 基本推定と計算
- 予測計算
- データソース
- 1次データ
- 2次データ
- 有償
- 公的
第2章 エグゼクティブサマリー
第3章 業界洞察
- エコシステム分析
- 規制状況
- 業界への影響要因
- 促進要因
- 業界の潜在的リスク&課題
- 成長可能性分析
- ポーターの分析
- PESTEL分析
第4章 競合情勢
- 戦略ダッシュボード
- イノベーションと持続可能性の展望
第5章 市場規模・予測:用途別、2021年~2034年
- 主要動向
- ウェアラブルデバイス
- 医療機器
- スマートカード
- 消費者向け製品
- その他
第6章 市場規模・予測:地域別、2021年~2034年
- 主要動向
- 北米
- 米国
- カナダ
- メキシコ
- 欧州
- ドイツ
- 英国
- フランス
- イタリア
- スペイン
- オーストリア
- スウェーデン
- アジア太平洋
- 中国
- 日本
- 韓国
- インド
- オーストラリア
- 世界のその他の地域
- ブラジル
- UAE
- サウジアラビア
第7章 企業プロファイル
- BrightVolt
- Cymbet
- Enfucell
- Ilika
- Imprint Energy
- Ion Storage Systems
- ITEN
- Jenax
- Johnson Energy Storage
- Molex
- Prieto Battery
- STMicroelectronics
The Global Rechargeable Thin Film Battery Market was valued at USD 144.3 million in 2024 and is expected to grow at a remarkable CAGR of 34.9% from 2025 to 2034. This growth is primarily driven by the increasing demand for compact, efficient, and reliable energy storage solutions across a wide range of industries. Thin film batteries are gaining traction due to their unique advantages, including their small size, lightweight design, and ability to deliver consistent performance over an extended lifecycle. These features make them ideal for applications in portable devices, particularly in sectors such as medical technology, wearables, and smart cards.
The rapid expansion of the Internet of Things (IoT) is further fueling the need for space-saving and dependable energy sources, creating significant opportunities for thin film battery manufacturers. Additionally, advancements in battery technology, such as improvements in energy density, safety, and sustainability, are enhancing the appeal of these batteries. As industries increasingly prioritize environmentally friendly and high-performance energy solutions, thin film batteries are emerging as a preferred choice. The market is also witnessing growing investments in research and development, which are accelerating innovation and driving the adoption of these advanced energy storage systems.
| Market Scope | |
|---|---|
| Start Year | 2024 |
| Forecast Year | 2025-2034 |
| Start Value | $144.3 Million |
| Forecast Value | $2.9 Billion |
| CAGR | 34.9% |
The wearable technology sector is expected to be a key driver of growth in the rechargeable thin film batteries market, with demand projected to grow at a CAGR of 34.2% through 2034. Thin film batteries are particularly well-suited for wearable devices due to their high energy density, compact form factor, and fast charging capabilities. These attributes enable manufacturers to design miniaturized and aesthetically appealing devices, such as smartwatches, fitness trackers, and health monitoring gadgets, that offer enhanced efficiency and longer battery life. As consumer demand for wearable technology continues to rise, thin film batteries are becoming an essential component in the development of innovative and durable products. Their ability to meet the stringent requirements of the wearables industry positions them as a critical enabler of growth in this segment.
The U.S. rechargeable thin film battery market is anticipated to generate USD 820 million by 2034, driven by the increasing demand for compact energy storage solutions in advanced electronics, wearables, and medical devices. Innovations in battery design, particularly in energy density and safety, are empowering U.S. manufacturers to produce cutting-edge batteries that cater to the evolving needs of these sectors. The growing adoption of IoT devices, smart cards, and next-generation medical implants is further contributing to market expansion. Additionally, the focus on sustainable and environmentally friendly technologies is accelerating the shift toward solid-state thin film batteries. Collaborations between scientific researchers and technology companies are playing a pivotal role in advancing the development and commercialization of these energy storage solutions. These efforts are positioning the U.S. as a leader in the global rechargeable thin film batteries market, ensuring its competitiveness in this rapidly evolving landscape.
Table of Contents
Chapter 1 Methodology & Scope
- 1.1 Market definitions
- 1.2 Base estimates & calculations
- 1.3 Forecast calculation
- 1.4 Data sources
- 1.4.1 Primary
- 1.4.2 Secondary
- 1.4.2.1 Paid
- 1.4.2.2 Public
Chapter 2 Executive Summary
- 2.1 Industry synopsis, 2021 – 2034
Chapter 3 Industry Insights
- 3.1 Industry ecosystem analysis
- 3.2 Regulatory landscape
- 3.3 Industry impact forces
- 3.3.1 Growth drivers
- 3.3.2 Industry pitfalls & challenges
- 3.4 Growth potential analysis
- 3.5 Porter's Analysis
- 3.5.1 Bargaining power of suppliers
- 3.5.2 Bargaining power of buyers
- 3.5.3 Threat of new entrants
- 3.5.4 Threat of substitutes
- 3.6 PESTEL Analysis
Chapter 4 Competitive landscape, 2024
- 4.1 Strategic dashboard
- 4.2 Innovation & sustainability landscape
Chapter 5 Market Size and Forecast, By Application, 2021 – 2034 (USD Million)
- 5.1 Key trends
- 5.2 Wearable devices
- 5.3 Medical
- 5.4 Smart cards
- 5.5 Consumer products
- 5.6 Others
Chapter 6 Market Size and Forecast, By Region, 2021 – 2034 (USD Million)
- 6.1 Key trends
- 6.2 North America
- 6.2.1 U.S.
- 6.2.2 Canada
- 6.2.3 Mexico
- 6.3 Europe
- 6.3.1 Germany
- 6.3.2 UK
- 6.3.3 France
- 6.3.4 Italy
- 6.3.5 Spain
- 6.3.6 Austria
- 6.3.7 Sweden
- 6.4 Asia Pacific
- 6.4.1 China
- 6.4.2 Japan
- 6.4.3 South Korea
- 6.4.4 India
- 6.4.5 Australia
- 6.5 Rest of World
- 6.5.1 Brazil
- 6.5.2 UAE
- 6.5.3 Saudi Arabia
Chapter 7 Company Profiles
- 7.1 BrightVolt
- 7.2 Cymbet
- 7.3 Enfucell
- 7.4 Ilika
- 7.5 Imprint Energy
- 7.6 Ion Storage Systems
- 7.7 ITEN
- 7.8 Jenax
- 7.9 Johnson Energy Storage
- 7.10 Molex
- 7.11 Prieto Battery
- 7.12 STMicroelectronics

