
|
市場調査レポート
商品コード
1750535
セラミックタイルの市場機会、成長促進要因、産業動向分析、2025~2034年予測Ceramic Tiles Market Opportunity, Growth Drivers, Industry Trend Analysis, and Forecast 2025 - 2034 |
||||||
カスタマイズ可能
|
|||||||
| セラミックタイルの市場機会、成長促進要因、産業動向分析、2025~2034年予測 |
|
出版日: 2025年05月15日
発行: Global Market Insights Inc.
ページ情報: 英文 140 Pages
納期: 2~3営業日
|

全表示
- 概要
- 目次
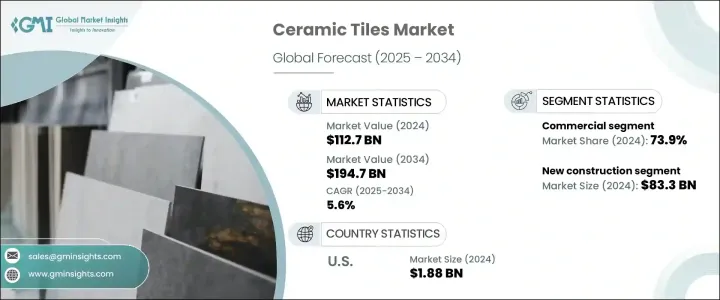
セラミックタイルの世界市場規模は、2024年に1,127億米ドルとなり、CAGR 5.6%で成長し、2034年には1,947億米ドルに達すると予測されています。
ここ数年、消費者の嗜好が従来の壁面用途よりも視覚的な魅力を高める床材デザインへと顕著に変化しています。このような嗜好の変化は、洗練されたインテリアへの憧れの高まり、現代的なライフスタイルの動向、都市部の急速な開発が大きく影響しています。個人も企業も美観に優れた環境づくりに注力する中、セラミックタイルの需要は高まり続けています。これらのタイルは、幅広いデザイン、仕上げ、カラーオプションを提供し、パーソナライゼーションのための十分な余地を提供します。このようなデザインの柔軟性により、消費者はタイルの選択を独自のスタイル要件に合わせることができるようになり、住宅と商業用途の両方で高い採用率につながっています。
この成長の主な要因は、タイル生産における高度なデジタル印刷技術の使用です。この技術革新により、製造業者は複雑でカスタマイズ可能なパターンを作成し、進化し続ける現代消費者の嗜好にアピールすることができます。このような技術の統合は、完成品に付加価値を与える高解像度のテクスチャや視覚効果の作成をサポートします。その結果、セラミックタイル業界は、変化するデザイン動向の中で、常にダイナミックで適切な存在であり続けることができるのです。美観だけでなく、タイルが持続可能な建材に適合することも、市場の拡大に拍車をかけています。セラミックタイルの多くは天然素材から作られているため、環境に配慮した建築に理想的です。耐久性、メンテナンスの必要性の低さ、エネルギー効率の高さは、建設分野での魅力をさらに高めています。
| 市場範囲 | |
|---|---|
| 開始年 | 2024 |
| 予測年 | 2025-2034 |
| 開始金額 | 1,127億米ドル |
| 予測金額 | 1,947億米ドル |
| CAGR | 5.6% |
用途に基づき、市場は新築と修繕・改築に区分されます。新築カテゴリーは主要セグメントとして浮上し、2024年には833億米ドルの収益を生み出します。予測期間中のCAGRは5.8%と予想されます。この成長は、グリーンビルディングの実践が重視されるようになり、持続可能なアーキテクチャに沿った近代的な建設資材の需要が高まっていることに起因しています。セラミックタイルは、機能性と見た目の美しさを併せ持つ理想的なソリューションを提供し、新しい開発において建築家や建設業者の最重要選択肢となっています。
最終用途別では、世界のセラミックタイル市場は住宅用と商業用に分かれています。商業部門が業界を支配し、2024年の市場シェアは73.9%です。商業ビルでは、耐久性があり、見た目も美しい表面へのニーズが高まっており、これが大きな成長要因となっています。オフィスビルから小売スペース、公共施設に至るまで、商業プロジェクトでは長寿命、安全性、美的価値を提供する床材ソリューションが求められています。セラミックタイルは、これらの要件を満たすと同時に、デザインの多様性とメンテナンスの容易さを提供し、大規模なインフラや不動産開発で好まれる選択肢となっています。
地方自治体による環境に優しいインフラやスマートビルディングへの取り組みへの注目が高まっていることも、商業空間におけるセラミックタイルの需要を促進している要因です。滑り止め機能やエネルギー効率の高い素材といった技術の進歩がセラミックタイルの機能性を高め、公共施設プロジェクトにおける市場の可能性をさらに広げています。
米国のセラミックタイル市場は2024年に18億8,000万米ドルとなり、予測期間を通じて力強い成長が見込まれています。この勢いは、住宅と商業開発の両方に多額の投資を続けている米国の建設部門の堅調な拡大が原動力となっています。建設活動に伴ってスタイリッシュで長持ちする素材へのニーズが高まる中、セラミックタイルはそのデザインの柔軟性と弾力性により、依然として最有力候補です。住宅から商業施設まで、多機能な表面への需要がセラミックタイル市場を後押しし続けています。
この業界の成長と革新に貢献している著名な企業には、China Ceramics Co., Ltd.、Ceramiche Atlas Concorde S.p.A.、Florida Tile, Inc、GRUPO LAMOSA、Gruppo Ceramiche Ricchetti S.p.A.、GRUPO PAMESA、KAJARIA CERAMICS、Porcelanosa Grupo、RAK CERAMICS、Mohawk Industries, Inc.、Ras Al Khaimah Ceramics、Siam Cement Group、Solvay S.A.、SCG CERAMICS、VICTORIA PLCなどがあります。これらの企業は、世界のセラミックタイル市場での存在感を高めるため、製品開発、製造効率、市場開拓に継続的に投資しています。
目次
第1章 調査手法と範囲
第2章 エグゼクティブサマリー
第3章 業界考察
- エコシステム分析
- バリューチェーンに影響を与える要因
- 利益率分析
- ディスラプション
- 将来の展望
- 製造業者
- 販売代理店
- トランプ政権による関税への影響
- 貿易への影響
- 貿易量の混乱
- 報復措置
- 業界への影響
- 供給側の影響(原材料)
- 主要原材料の価格変動
- サプライチェーンの再構築
- 生産コストへの影響
- 需要側の影響(顧客へのコスト)
- 最終市場への価格伝達
- 市場シェアの動向
- 消費者の反応パターン
- 供給側の影響(原材料)
- 影響を受ける主要企業
- 戦略的な業界対応
- サプライチェーンの再構成
- 価格設定と製品戦略
- 政策関与
- 展望と今後の検討事項
- 貿易への影響
- サプライヤーの情勢
- 利益率分析
- 技術概要
- 規制情勢
- 影響要因
- 促進要因
- 耐久性とスタイリッシュさを兼ね備えた床材ソリューションの需要増加
- 都市化とインフラ開発
- リノベーションとリフォームの動向
- 業界の潜在的リスク&課題
- 原材料費と入手可能性
- 促進要因
- 成長可能性分析
- ポーター分析
- PESTEL分析
第4章 競合情勢
- イントロダクション
- 企業の市場シェア分析
- 競合ポジショニングマトリックス
- 戦略的展望マトリックス
第5章 市場推計・予測:用途別、2021-2034
- 主要動向
- 修理と改修
- 新築
第6章 市場推計・予測:製品別、2021-2034
- 主要動向
- 床タイル
- 壁タイル
- その他
第7章 市場推計・予測:最終用途別、2021-2034
- 主要動向
- 住宅用
- 商業用
第8章 市場推計・予測:地域別、2021-2034
- 主要動向
- 北米
- 米国
- カナダ
- 欧州
- 英国
- ドイツ
- フランス
- イタリア
- スペイン
- ロシア
- アジア太平洋地域
- 中国
- インド
- 日本
- 韓国
- オーストラリア
- インドネシア
- マレーシア
- ラテンアメリカ
- ブラジル
- メキシコ
- 中東・アフリカ
- サウジアラビア
- 南アフリカ
- アラブ首長国連邦
第9章 企業プロファイル
- Ceramiche Atlas Concorde S.p.A.
- China Ceramics Co.、Ltd.
- Crossville、Inc. ai Peroxide Company Limited
- Florida Tile、Inc.
- GRUPO LAMOSA
- GRUPO PAMESA
- Gruppo Ceramiche Ricchetti S.p.A.
- KAJARIA CERAMICS
- Mohawk Industries、Inc.
- Porcelanosa Grupo
- RAK CERAMICS
- Ras Al Khaimah Ceramics
- SCG CERAMICS
- Siam Cement Group
- Solvay S.A.
- VICTORIA PLC
The Global Ceramic Tiles Market was valued at USD 112.7 billion in 2024 and is estimated to grow at a CAGR of 5.6% to reach USD 194.7 billion by 2034. Over the past few years, there has been a noticeable shift in consumer preferences toward flooring designs that enhance visual appeal more than traditional wall applications. This changing preference is largely influenced by a growing desire for sophisticated interiors, modern lifestyle trends, and the rapid development of urban areas. As individuals and businesses alike focus on creating aesthetically pleasing environments, the demand for ceramic tiles continues to rise. These tiles offer a wide array of designs, finishes, and color options, which provide ample room for personalization. This level of design flexibility empowers consumers to match tile selections with their unique stylistic requirements, leading to higher adoption across both residential and commercial applications.
A major factor contributing to this growth is the use of advanced digital printing technologies in tile production. This innovation enables manufacturers to create intricate and customizable patterns that appeal to the ever-evolving tastes of modern consumers. The integration of such technologies supports the creation of high-resolution textures and visual effects, which add value to the finished product. In turn, this keeps the ceramic tiles industry dynamic and relevant in the face of changing design trends. Alongside aesthetics, the tiles' compatibility with sustainable construction materials has also fueled market expansion. Many ceramic tiles are made from natural ingredients, which makes them an ideal fit for environmentally conscious building initiatives. Their durability, low maintenance needs, and energy efficiency further strengthen their appeal in the construction sector.
| Market Scope | |
|---|---|
| Start Year | 2024 |
| Forecast Year | 2025-2034 |
| Start Value | $112.7 Billion |
| Forecast Value | $194.7 Billion |
| CAGR | 5.6% |
Based on usage, the market is segmented into new construction and repairs & renovations. The new construction category emerged as the leading segment, generating USD 83.3 billion in revenue in 2024. It is anticipated to grow at a CAGR of 5.8% over the forecast period. This growth can be attributed to the increasing emphasis on green building practices and the rising demand for modern construction materials that align with sustainable architecture. Ceramic tiles offer an ideal solution by combining functionality with visual appeal, making them a top choice for architects and builders in new developments.
In terms of end-use, the global ceramic tiles market is divided into residential and commercial segments. The commercial sector dominated the industry, holding a market share of 73.9% in 2024. The growing need for durable and visually attractive surfaces in commercial buildings has been a major growth driver. From office buildings to retail spaces and public facilities, commercial projects demand flooring solutions that offer longevity, safety, and aesthetic value. Ceramic tiles meet these requirements while also offering design versatility and easy maintenance, making them a preferred option for large-scale infrastructure and real estate developments.
The increasing focus on eco-friendly infrastructure and smart building initiatives by local and regional governments is another factor propelling the demand for ceramic tiles in commercial spaces. Technological advancements such as anti-slip features and energy-efficient materials have enhanced the functionality of ceramic tiles, further expanding their market potential in public and institutional projects.
In the United States, the ceramic tiles market was valued at USD 1.88 billion in 2024 and is expected to experience strong growth throughout the forecast period. This momentum is driven by the robust expansion of the U.S. construction sector, which continues to invest heavily in both residential and commercial developments. As the need for stylish and long-lasting materials grows in line with construction activity, ceramic tiles remain a top contender due to their design flexibility and resilience. From residential homes to commercial properties, the demand for multifunctional surfaces continues to boost the ceramic tile market.
Prominent players contributing to the growth and innovation in this industry include China Ceramics Co., Ltd., Ceramiche Atlas Concorde S.p.A., Florida Tile, Inc., Crossville, Inc., GRUPO LAMOSA, Gruppo Ceramiche Ricchetti S.p.A., GRUPO PAMESA, KAJARIA CERAMICS, Porcelanosa Grupo, RAK CERAMICS, Mohawk Industries, Inc., Ras Al Khaimah Ceramics, Siam Cement Group, Solvay S.A., SCG CERAMICS, and VICTORIA PLC. These companies are continuously investing in product development, manufacturing efficiency, and market expansion to strengthen their presence in the global ceramic tiles market.
Table of Contents
Chapter 1 Methodology & Scope
- 1.1 Market scope & definitions
- 1.2 Base estimates & calculations
- 1.3 Forecast calculations
- 1.4 Data sources
- 1.4.1 Primary
- 1.4.2 Secondary
- 1.4.2.1 Paid sources
- 1.4.2.2 Public sources
Chapter 2 Executive Summary
- 2.1 Industry 3600 synopsis, 2021-2034
Chapter 3 Industry Insights
- 3.1 Industry ecosystem analysis
- 3.1.1 Factor affecting the value chain
- 3.1.2 Profit margin analysis
- 3.1.3 Disruptions
- 3.1.4 Future outlook
- 3.1.5 Manufacturers
- 3.1.6 Distributors
- 3.2 Impact of Trump administration tariffs
- 3.2.1 Trade impact
- 3.2.1.1 Trade volume disruptions
- 3.2.1.2 Retaliatory measures
- 3.2.2 Impact on industry
- 3.2.2.1 Supply-side impact (raw materials)
- 3.2.2.1.1 Price volatility in key materials
- 3.2.2.1.2 Supply chain restructuring
- 3.2.2.1.3 Production cost implications
- 3.2.2.2 Demand-side impact (Cost to customers)
- 3.2.2.2.1 Price transmission to end markets
- 3.2.2.2.2 Market share dynamics
- 3.2.2.2.3 Consumer response patterns
- 3.2.2.1 Supply-side impact (raw materials)
- 3.2.3 Key companies impacted
- 3.2.4 Strategic industry responses
- 3.2.4.1 Supply chain reconfiguration
- 3.2.4.2 Pricing and product strategies
- 3.2.4.3 Policy engagement
- 3.2.5 Outlook & future considerations
- 3.2.1 Trade impact
- 3.3 Supplier landscape
- 3.4 Profit margin analysis
- 3.5 Technological overview
- 3.6 Regulatory landscape
- 3.7 Impact forces
- 3.7.1 Growth drivers
- 3.7.1.1 Increasing demand for durable and stylish flooring solutions
- 3.7.1.2 Urbanization and Infrastructure Development
- 3.7.1.3 Renovation and Remodeling Trends
- 3.7.2 Industry pitfalls & challenges
- 3.7.2.1 Raw Material Costs and Availability
- 3.7.1 Growth drivers
- 3.8 Growth potential analysis
- 3.9 Porter's analysis
- 3.10 PESTEL analysis
Chapter 4 Competitive Landscape, 2024
- 4.1 Introduction
- 4.2 Company market share analysis
- 4.3 Competitive positioning matrix
- 4.4 Strategic outlook matrix
Chapter 5 Market Estimates & Forecast, By Usage, 2021-2034 (USD Billion) (Million Square Meters)
- 5.1 Key trends
- 5.2 Repairs & renovation
- 5.3 New construction
Chapter 6 Market Estimates & Forecast, By Product, 2021-2034 (USD Billion) (Million Square Meters)
- 6.1 Key trends
- 6.2 Floor tiles
- 6.3 Wall tiles
- 6.4 Others
Chapter 7 Market Estimates & Forecast, By End Use, 2021-2034 (USD Billion) (Million Square Meters)
- 7.1 Key trends
- 7.2 Residential
- 7.3 Commercial
Chapter 8 Market Estimates & Forecast, By Region, 2021-2034 (USD Billion) (Million Square Meters)
- 8.1 Key trends
- 8.2 North America
- 8.2.1 U.S.
- 8.2.2 Canada
- 8.3 Europe
- 8.3.1 UK
- 8.3.2 Germany
- 8.3.3 France
- 8.3.4 Italy
- 8.3.5 Spain
- 8.3.6 Russia
- 8.4 Asia Pacific
- 8.4.1 China
- 8.4.2 India
- 8.4.3 Japan
- 8.4.4 South Korea
- 8.4.5 Australia
- 8.4.6 Indonesia
- 8.4.7 Malaysia
- 8.5 Latin America
- 8.5.1 Brazil
- 8.5.2 Mexico
- 8.6 MEA
- 8.6.1 Saudi Arabia
- 8.6.2 South Africa
- 8.6.3 UAE
Chapter 9 Company Profiles
- 9.1 Ceramiche Atlas Concorde S.p.A.
- 9.2 China Ceramics Co., Ltd.
- 9.3 Crossville, Inc. ai Peroxide Company Limited
- 9.4 Florida Tile, Inc.
- 9.5 GRUPO LAMOSA
- 9.6 GRUPO PAMESA
- 9.7 Gruppo Ceramiche Ricchetti S.p.A.
- 9.8 KAJARIA CERAMICS
- 9.9 Mohawk Industries, Inc.
- 9.10 Porcelanosa Grupo
- 9.11 RAK CERAMICS
- 9.12 Ras Al Khaimah Ceramics
- 9.13 SCG CERAMICS
- 9.14 Siam Cement Group
- 9.15 Solvay S.A.
- 9.16 VICTORIA PLC
