
搬送機器の市場機会、成長促進要因、産業動向分析、2025~2034年予測
Conveying Equipment Market Opportunity, Growth Drivers, Industry Trend Analysis, and Forecast 2025 - 2034- 発行日
- ページ情報
- 英文 160 Pages
- 納期
- 2~3営業日
- 商品コード
- 1750611
- カスタマイズ可能 お客様のご希望に応じて、既存データの加工や未掲載情報(例:国別セグメント)の追加などの対応が可能です。詳細はお問い合わせください。
- 翻訳ツール提供対象 PDF対応AI翻訳ツールの無料貸し出しサービスのご利用が可能です
概要
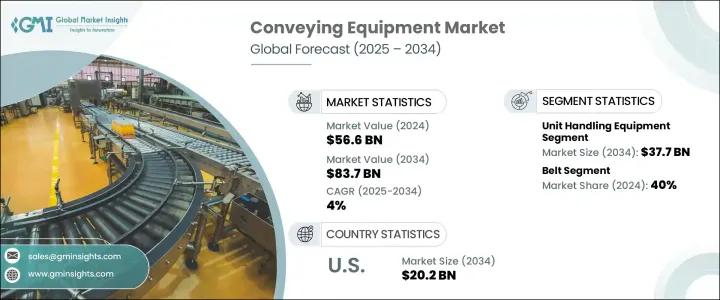
搬送機器の世界市場規模は、2024年に566億米ドルとなり、CAGR 4%で成長し、2034年には837億米ドルに達すると予測されています。
この着実な成長は、急速な産業開発、オートメーション技術の絶え間ない革新、ロジスティクスとサプライチェーンネットワークにおける需要の進化によって形成されています。産業が事業を拡大し、より合理化された生産モデルに適応するにつれ、信頼性が高く効率的でインテリジェント搬送システムの必要性が加速しています。生産性、持続可能性、オペレーションの柔軟性が各セグメントで重視されるようになり、機器メーカーやシステムインテグレーターに大きなビジネス機会が生まれています。
飲食品、自動車、鉱業、製薬などの産業部門は、先進的搬送ソリューションの統合を含むプロセスの最適化を優先しています。これらのセグメントでは、高い処理能力、人的介入の削減、安全性の向上が求められており、自動化システムへの投資が促されています。スマートマニュファクチャリングとデジタル化に対する各地域の政府の支援は、最新のマテリアルハンドリング技術の採用に勢いを与えています。シームレスなオペレーションへの推進と、主要市場で進行中の労働力不足も、企業が手作業によるハンドリング作業を、精度を向上させダウンタイムを削減する自動コンベアシステムに置き換えることを促しています。デジタルトランスフォーメーションによって生産・倉庫環境が再構築される中、搬送機器はマテリアルフローを中断することなく維持し、ボトルネックを削減するために不可欠な存在であり続けています。
| 市場範囲 | |
|---|---|
| 開始年 | 2024年 |
| 予測年 | 2025~2034年 |
| 開始金額 | 566億米ドル |
| 予測金額 | 837億米ドル |
| CAGR | 4% |
市場セグメンテーションでは、市場はバルクハンドリング機器、ユニットハンドリング機器、部品と付属品に分類されます。このうちユニットハンドリング機器は、2024年の売上高が255億米ドルで市場をリードし、2034年には377億米ドルに達すると予測されています。このセグメントの急成長の背景には、eコマース部門の拡大、倉庫業務の増加、軽工業業務の増加があります。ユニットハンドリングシステムは、箱、小包、コンテナなどの個々の品目を輸送するのに理想的で、注文処理センターや配送ハブに不可欠です。小売業者やロジスティクスプロバイダは、出荷量の増加や厳しい納期に合わせて、先進的なコンベアシステムに投資しています。
ユニットコンベアの採用は、精密性、衛生性、製品の完全性が要求されるセグメントでも拡大しています。医薬品、食品加工、消費財などの産業では、コンタミネーションコントロールやクリーンルーム対応のシステムに対する需要が高まっています。品質と安全基準への期待が高まるにつれ、企業はその信頼性と柔軟性からユニットハンドリングコンベアに注目しています。さらに、郵便や宅配便サービスにおける自動化への投資の高まりが、スピードと精度を向上させ、より大量の荷物を処理できるシステムへの需要を後押ししています。
機器タイプによって、搬送機器市場はローラー、ベルト、パレット、チェーンコンベア、オーバーヘッド、その他に分類されます。2024年にはベルトコンベアが市場の40%を占め、2034年のCAGRは4.3%を超えると予測されています。ベルトコンベアは汎用性が高く、さまざまな材料をさまざまな距離で搬送できるため、広く使用されています。傾斜地での運転や複雑な地形での移動が可能なため、継続的な材料の流れが不可欠な環境に適しています。
ベルトコンベアは、バルク品であれ包装品であれ、物品の絶え間ない移動を必要とする産業で強い存在感を示しています。手作業を減らし、生産性を向上させ、特定のマテリアルハンドリングのニーズに適応するというベルトコンベアの役割は、その広範な展開を支え続けています。製造・貯蔵施設では、リアルタイムのモニタリングとシステムの最適化のためのスマート技術を統合したエネルギー効率の高いベルトシステムへの関心が高まっています。
2024年には、米国が世界市場の主要貢献国として浮上し、131億米ドルの収益を上げ、2034年には202億米ドルにまで上昇すると予測されています。米国市場は、製造、倉庫、ロジスティクス業務の自動化の進展による恩恵を受けています。人件費の上昇と業務効率化の必要性から、企業はダウンタイムを最小限に抑え、安全性を向上させ、処理能力を高めることができる搬送システムを求めています。産業がデジタル統合に向かうにつれ、予知保全とリアルタイムデータ追跡を提供する搬送ソリューションが標準になりつつあります。
再投資と国内生産の拡大へのシフトは、自動マテリアルハンドリングシステムへの需要をさらに強めています。企業が設備の近代化や物流インフラの強化に投資する中、搬送機器はこの変革を支える重要な役割を担っています。自動車、消費財、食品加工などのセクタからの強い需要が米国市場の展望を形成し続けており、革新と業務効率が購買決定の最前線となっています。
世界の搬送機器産業の主要企業には、EZ Loader、Boatmate Trailers、Hydrotrans、Kropf Industrial、Karavan Trailers、Load Rite Trailers、Midwest、Magic Tilt Trailers、TRIGANO、Venture Trailersなどがあります。これらの企業は、技術革新による製品能力の向上と、戦略的パートナーシップと的を絞った投資による市場での足跡の拡大に注力しています。
目次
第1章 調査手法と範囲
第2章 エグゼクティブサマリー
第3章 産業考察
- エコシステム分析
- トランプ政権による関税への影響
- 貿易への影響
- 貿易量の混乱
- 報復措置
- 産業への影響
- 供給側の影響(原料)
- 主要原料の価格変動
- サプライチェーンの再構築
- 生産コストへの影響
- 需要側の影響(顧客へのコスト)
- 最終市場への価格伝達
- 市場シェアの動向
- 消費者の反応パターン
- 供給側の影響(原料)
- 影響を受ける主要企業
- 戦略的な産業対応
- サプライチェーンの再構成
- 価格設定と製品戦略
- 施策関与
- 展望と今後の検討事項
- 貿易への影響
- 利益率分析
- 技術とイノベーションの情勢
- 主要ニュースと取り組み
- 規制情勢
- 影響要因
- 促進要因
- 海洋観光の成長
- 漁業活動の増加
- トレーラー設計における技術的進歩
- ボートレンタルとシェアリングサービスの成長
- カスタマイズ需要の増加
- 産業の潜在的リスク・課題
- 初期費用と運用コストが高め
- 腐食とメンテナンスの問題
- 促進要因
- 成長可能性分析
- ポーター分析
- PESTEL分析
第4章 競合情勢
- イントロダクション
- 企業の市場シェア分析
- 競合ポジショニングマトリックス
- 戦略的展望マトリックス
第5章 市場推定・予測:製品別、2021~2034年
- 主要動向
- バルクハンドリング機器
- ユニットハンドリング機器
- 部品と付属品
第6章 市場推定・予測:機器タイプ別、2021~2034年
- 主要動向
- ベルト
- ローラー
- パレット
- オーバーヘッド
- チェーンコンベア
- その他
第7章 市場推定・予測:用途別、2021~2034年
- 主要動向
- 耐久製造
- 飲食品
- 雑貨
- 鉱業と建設
- 輸送
- 倉庫と配送
- その他(空港など)
第8章 市場推定・予測:流通チャネル別、2021~2034年
- 主要動向
- 直接
- 間接
第9章 市場推定・予測:地域別、2021~2034年
- 主要動向
- 北米
- 米国
- カナダ
- 欧州
- 英国
- ドイツ
- フランス
- イタリア
- スペイン
- ロシア
- アジア太平洋
- 中国
- インド
- 日本
- 韓国
- オーストラリア
- ラテンアメリカ
- ブラジル
- メキシコ
- 中東・アフリカ
- アラブ首長国連邦
- サウジアラビア
- 南アフリカ
第10章 企業プロファイル
- BEUMER GROUP
- Continental
- Daifuku
- Emerson Electric
- Fives Group
- FlexLink
- Honeywell
- Jungheinrich
- Kardex
- Kion Group
- KUKA
- Murata Machinery
- Phoenix Conveyor Belt Systems
- Siemens
- TGW Logistics Group
目次
The Global Conveying Equipment Market was valued at USD 56.6 billion in 2024 and is estimated to grow at a CAGR of 4% to reach USD 83.7 billion by 2034. This steady growth is being shaped by rapid industrial development, constant innovation in automation technologies, and evolving demands within logistics and supply chain networks. As industries scale operations and adapt to more streamlined production models, the need for reliable, efficient, and intelligent conveying systems is accelerating. The rising emphasis on productivity, sustainability, and operational flexibility across sectors is creating substantial opportunities for equipment manufacturers and system integrators.
Industrial sectors such as food and beverage, automotive, mining, and pharmaceuticals are prioritizing process optimization, which includes the integration of advanced conveying solutions. These sectors demand high throughput, reduced human intervention, and enhanced safety, prompting organizations to invest in automated systems. Government support for smart manufacturing and digitization across regions is adding momentum to the adoption of modern material handling technologies. The push toward seamless operations and the ongoing labor shortages in key markets are also prompting enterprises to replace manual handling tasks with automated conveyor systems that improve accuracy and reduce downtime. As digital transformation reshapes production and warehouse environments, conveying equipment remains critical to maintaining uninterrupted material flow and reducing bottlenecks.
| Market Scope | |
|---|---|
| Start Year | 2024 |
| Forecast Year | 2025-2034 |
| Start Value | $56.6 Billion |
| Forecast Value | $83.7 Billion |
| CAGR | 4% |
In terms of product segmentation, the market is categorized into bulk handling equipment, unit handling equipment, and parts & accessories. Among these, unit handling equipment led the market in 2024 with a revenue of USD 25.5 billion and is anticipated to reach USD 37.7 billion by 2034. The fast-paced growth of this segment is attributed to the expanding e-commerce sector, increased warehousing activities, and a rise in light manufacturing operations. Unit handling systems are ideal for transporting individual items such as boxes, parcels, and containers-making them indispensable in order fulfillment centers and distribution hubs. Retailers and logistics providers are investing in advanced conveyor systems to keep pace with rising shipment volumes and tighter delivery timelines.
The adoption of unit conveyors is also expanding in sectors that require precision, hygiene, and product integrity. Industries, including pharmaceuticals, food processing, and consumer goods, are driving demand for systems that offer contamination control and cleanroom compatibility. As expectations for quality and safety standards increase, companies are turning to unit handling conveyors for their reliability and flexibility. Furthermore, growing investment in automation across postal and courier services is propelling demand for systems that can handle higher volumes with increased speed and accuracy.
Based on equipment type, the conveying equipment market is categorized into roller, belt, pallet, chain conveyors, overhead, and others. In 2024, belt conveyors accounted for 40% of the market and are projected to grow at a CAGR exceeding 4.3% through 2034. These conveyors are widely used due to their versatility and capability to transport a wide range of materials over varied distances. Their ability to operate on inclines and navigate complex terrain makes them well-suited for environments where continuous material flow is essential.
Belt conveyors have a strong presence in industries that require the constant movement of goods-whether bulk or packaged. Their role in reducing manual handling, enhancing productivity, and adapting to specific material handling needs continues to support their widespread deployment. In manufacturing and storage facilities, there is increasing interest in energy-efficient belt systems that integrate smart technologies for real-time monitoring and system optimization.
In 2024, the United States emerged as a key contributor to the global market, generating revenue of USD 13.1 billion, with projections indicating it will climb to USD 20.2 billion by 2034. The US market is benefiting from increased automation across manufacturing, warehousing, and logistics operations. With rising labor costs and the need for operational efficiency, businesses are seeking to convey systems that can minimize downtime, improve safety, and enhance throughput. As industries move toward digital integration, conveying solutions that offer predictive maintenance and real-time data tracking are becoming standard.
The shift toward reshoring and expanding domestic production is further strengthening the demand for automated material handling systems. As companies invest in modernizing facilities and enhancing logistics infrastructure, conveying equipment is playing a crucial role in supporting this transformation. Strong demand from sectors like automotive, consumer goods, and food processing continues to shape the US market outlook, with innovation and operational efficiency at the forefront of purchasing decisions.
Leading players in the global conveying equipment industry include EZ Loader, Boatmate Trailers, Hydrotrans, Kropf Industrial, Karavan Trailers, Load Rite Trailers, Midwest, Magic Tilt Trailers, TRIGANO, and Venture Trailers. These companies are focused on enhancing product capabilities through innovation and expanding their market footprint through strategic partnerships and targeted investments.
Table of Contents
Chapter 1 Methodology & Scope
- 1.1 Research design
- 1.1.1 Research approach
- 1.1.2 Data collection methods
- 1.2 Base estimates and calculations
- 1.2.1 Base year calculation
- 1.2.2 Key trends for market estimates
- 1.3 Forecast model
- 1.4 Primary research & validation
- 1.4.1 Primary sources
- 1.4.2 Data mining sources
- 1.5 Market definitions
Chapter 2 Executive Summary
- 2.1 Industry 3600 synopsis, 2021 - 2034
Chapter 3 Industry Insights
- 3.1 Industry ecosystem analysis
- 3.2 Impact of Trump administration tariffs
- 3.2.1 Trade impact
- 3.2.1.1 Trade volume disruptions
- 3.2.1.2 Retaliatory measures
- 3.2.2 Impact on industry
- 3.2.2.1 Supply-side impact (raw materials)
- 3.2.2.1.1 Price volatility in key materials
- 3.2.2.1.2 Supply chain restructuring
- 3.2.2.1.3 Production cost implications
- 3.2.2.2 Demand-side impact (Cost to customers)
- 3.2.2.2.1 Price transmission to end markets
- 3.2.2.2.2 Market share dynamics
- 3.2.2.2.3 Consumer response patterns
- 3.2.2.1 Supply-side impact (raw materials)
- 3.2.3 Key companies impacted
- 3.2.4 Strategic industry responses
- 3.2.4.1 Supply chain reconfiguration
- 3.2.4.2 Pricing and product strategies
- 3.2.4.3 Policy engagement
- 3.2.5 Outlook & future considerations
- 3.2.1 Trade impact
- 3.3 Profit margin analysis
- 3.4 Technology & innovation landscape
- 3.5 Key news & initiatives
- 3.6 Regulatory landscape
- 3.7 Impact on forces
- 3.7.1 Growth drivers
- 3.7.1.1 Growth in marine tourism
- 3.7.1.2 Increase in fishing activities
- 3.7.1.3 Technological advancements in trailer design
- 3.7.1.4 Growth in boat rental and sharing services
- 3.7.1.5 Rise in customization demand
- 3.7.2 Industry pitfalls & challenges
- 3.7.2.1 High initial and operating costs
- 3.7.2.2 Corrosion and maintenance issues
- 3.7.1 Growth drivers
- 3.8 Growth potential analysis
- 3.9 Porter's analysis
- 3.10 PESTEL analysis
Chapter 4 Competitive Landscape, 2024
- 4.1 Introduction
- 4.2 Company market share analysis
- 4.3 Competitive positioning matrix
- 4.4 Strategic outlook matrix
Chapter 5 Market Estimates & Forecast, By Product, 2021 - 2034 ($Bn, Thousand Units)
- 5.1 Key trends
- 5.2 Bulk handling equipment
- 5.3 Unit handling equipment
- 5.4 Parts & accessories
Chapter 6 Market Estimates & Forecast, By Equipment Type, 2021 - 2034 ($Bn, Thousand Units)
- 6.1 Key trends
- 6.2 Belt
- 6.3 Roller
- 6.4 Pallet
- 6.5 Overhead
- 6.6 Chain conveyors
- 6.7 Others
Chapter 7 Market Estimates & Forecast, By Application, 2021 - 2034 ($Bn, Thousand Units)
- 7.1 Key trends
- 7.2 Durable manufacturing
- 7.3 Food & beverage
- 7.4 General merchandise
- 7.5 Mining & construction
- 7.6 Transportation
- 7.7 Warehouse & distribution
- 7.8 Others (airports, etc.)
Chapter 8 Market Estimates & Forecast, By Distribution Channel, 2021 - 2034 ($Bn, Thousand Units)
- 8.1 Key trends
- 8.2 Direct
- 8.3 Indirect
Chapter 9 Market Estimates & Forecast, By Region, 2021 - 2034 ($Bn, Thousand Units)
- 9.1 Key trends
- 9.2 North America
- 9.2.1 U.S.
- 9.2.2 Canada
- 9.3 Europe
- 9.3.1 UK
- 9.3.2 Germany
- 9.3.3 France
- 9.3.4 Italy
- 9.3.5 Spain
- 9.3.6 Russia
- 9.4 Asia Pacific
- 9.4.1 China
- 9.4.2 India
- 9.4.3 Japan
- 9.4.4 South Korea
- 9.4.5 Australia
- 9.5 Latin America
- 9.5.1 Brazil
- 9.5.2 Mexico
- 9.6 MEA
- 9.6.1 UAE
- 9.6.2 Saudi Arabia
- 9.6.3 South Africa
Chapter 10 Company Profiles
- 10.1 BEUMER GROUP
- 10.2 Continental
- 10.3 Daifuku
- 10.4 Emerson Electric
- 10.5 Fives Group
- 10.6 FlexLink
- 10.7 Honeywell
- 10.8 Jungheinrich
- 10.9 Kardex
- 10.10 Kion Group
- 10.11 KUKA
- 10.12 Murata Machinery
- 10.13 Phoenix Conveyor Belt Systems
- 10.14 Siemens
- 10.15 TGW Logistics Group
- 発行日
- 発行
- Global Market Insights Inc.
- ページ情報
- 英文 160 Pages
- 納期
- 2~3営業日


