
|
市場調査レポート
商品コード
1666918
中流石油・ガス分析の市場機会、成長促進要因、産業動向分析、2025年~2034年予測Midstream Oil and Gas Analytics Market Opportunity, Growth Drivers, Industry Trend Analysis, and Forecast 2025 - 2034 |
||||||
カスタマイズ可能
|
|||||||
| 中流石油・ガス分析の市場機会、成長促進要因、産業動向分析、2025年~2034年予測 |
|
出版日: 2024年12月27日
発行: Global Market Insights Inc.
ページ情報: 英文 110 Pages
納期: 2~3営業日
|

全表示
- 概要
- 目次
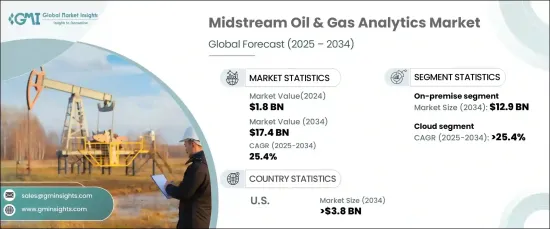
世界の中流石油・ガス分析市場は、2024年に18億米ドルに達し、2034年までCAGR25.4%の堅調な成長率で拡大する見通しです。
この成長の原動力は、中流部門における業務効率の向上とコスト管理に対する需要の高まりです。
この業界の企業は、パイプラインの運用を最適化し、資産パフォーマンスを監視し、より多くの情報に基づいた意思決定をサポートするために、高度な分析を採用しています。予測分析は重要な役割を果たし、オペレーターが潜在的な機器の故障を検出し、大きな問題に発展する前に問題に対処できるよう支援します。このプロアクティブなアプローチは、ダウンタイムとメンテナンスコストの削減につながり、この分野での普及を後押ししています。
| 市場範囲 | |
|---|---|
| 開始年 | 2024年 |
| 予測年 | 2025年~2034年 |
| 開始金額 | 18億米ドル |
| 予測金額 | 174億米ドル |
| CAGR | 25.4% |
人工知能(AI)と機械学習(ML)のアナリティクスツールへの統合は、石油・ガス中流業界を大きく再構築しています。これらの技術は、大規模なデータセットを処理して新たな動向を特定し、需要を予測し、サプライチェーンを最適化することで、より深い洞察を可能にします。また、AIを活用したアナリティクスは、リアルタイムの異常を検出することで安全プロトコルを強化し、オペレーターが潜在的なリスクに迅速に対応できるようにします。
同市場は、オンプレミスとクラウドベースのソリューションなど、展開モデルによって分けられます。オンプレミス型セグメントは、2034年までに129億米ドルを超えると予想され、データセキュリティを優先し、機密情報の管理を維持したい企業に支持されています。オンプレミスソリューションは、既存のITインフラとのシームレスな統合を実現し、外部ネットワークに依存することなく高いパフォーマンスとリアルタイム分析を保証します。
さらに、市場はプロフェッショナル、クラウド、統合などのサービス別に分類されます。クラウド分野は、その費用対効果、拡張性、アクセスの容易さにより、2034年までのCAGRが24.5%を超える成長が予測されています。クラウドソリューションはリアルタイムのデータ分析と遠隔監視を可能にし、オペレーターがタイムリーな意思決定を行うのに役立ちます。また、これらのプラットフォームは、モノのインターネット(IoT)デバイスとのシームレスな統合を実現し、運用の可視性を高めながら、ITインフラのコストを削減します。クラウドベースの分析には柔軟性があるため、動的なワークロードの管理、需要予測、パイプライン効率の最適化に最適です。
米国の中流石油・ガス分析市場は、2034年までに38億米ドルを超えると予測されています。この成長の原動力は、パイプラインインフラへの投資の増加と最先端技術の採用です。分析ツールは現在、輸送の最適化、資産パフォーマンスの監視、規制遵守の確保に不可欠となっています。さらに、AIとIoT技術の組み合わせにより、リアルタイムのモニタリングと予知保全が可能になり、運用のダウンタイムとコストの削減に貢献しています。
目次
第1章 調査手法と調査範囲
- 市場の定義
- 基本推定と計算
- 予測計算
- データソース
- 一次
- 二次
- 有償
- 公的
第2章 エグゼクティブサマリー
第3章 業界洞察
- 業界エコシステム分析
- 規制状況
- 業界への影響要因
- 成長促進要因
- 業界の潜在的リスク・課題
- 成長ポテンシャル分析
- ポーター分析
- 供給企業の交渉力
- 買い手の交渉力
- 新規参入業者の脅威
- 代替品の脅威
- PESTEL分析
第4章 競合情勢
- 戦略ダッシュボード
- イノベーションと持続可能性の展望
第5章 市場規模・予測:展開別、2021年~2034年
- 主要動向
- オンプレミス型
- ホスト型
第6章 市場規模・予測:サービス別、2021年~2034年
- 主要動向
- プロフェッショナル
- クラウド
- インテグレーション
第7章 市場規模・予測:用途別、2021年~2034年
- 主要動向
- パイプラインSCADA
- フリート
- ストレージ最適化
第8章 市場規模・予測:地域別、2021年~2034年
- 主要動向
- 北米
- 米国
- カナダ
- メキシコ
- 欧州
- 英国
- フランス
- ドイツ
- イタリア
- ロシア
- スペイン
- アジア太平洋
- 中国
- オーストラリア
- インド
- 日本
- 韓国
- 中東・アフリカ
- サウジアラビア
- アラブ首長国連邦
- トルコ
- 南アフリカ
- エジプト
- ラテンアメリカ
- ブラジル
- アルゼンチン
第9章 企業プロファイル
- Accenture
- Capgemini
- Cisco Systems
- Cognizant
- Deloitte
- Hewlett Packard Enterprise
- Hitachi
- IBM
- Microsoft
- Oracle
- SAP
- SAS Institute
- Tableau Software
- Teradata
- TIBCO Software
The Global Midstream Oil And Gas Analytics Market reached USD 1.8 billion in 2024 and is poised to expand at a robust growth rate of 25.4% CAGR through 2034. This growth is driven by the increasing demand for enhanced operational efficiency and cost management within the midstream sector.
Companies in the industry are adopting advanced analytics to optimize their pipeline operations, monitor asset performance, and support more informed decision-making. Predictive analytics plays a critical role, helping operators detect potential equipment failures and address issues before they become major problems. This proactive approach leads to reduced downtime and maintenance costs, encouraging widespread use across the sector.
| Market Scope | |
|---|---|
| Start Year | 2024 |
| Forecast Year | 2025-2034 |
| Start Value | $1.8 Billion |
| Forecast Value | $17.4 Billion |
| CAGR | 25.4% |
The integration of artificial intelligence (AI) and machine learning (ML) into analytics tools is significantly reshaping the midstream oil and gas industry. These technologies enable deeper insights by processing large datasets to identify emerging trends, forecast demand, and optimize supply chains. AI-powered analytics also enhance safety protocols by detecting real-time anomalies, enabling operators to act swiftly in response to potential risks.
The market is divided by deployment models, including on-premise and cloud-based solutions. The on-premise segment is expected to surpass USD 12.9 billion by 2034, favored by companies that prioritize data security and wish to maintain control over sensitive information. On-premise solutions offer seamless integration with existing IT infrastructures, ensuring high performance and real-time analytics without depending on external networks.
In addition, the market is categorized by services such as professional, cloud, and integration. The cloud segment is projected to grow at a CAGR exceeding 24.5% through 2034, driven by its cost-effectiveness, scalability, and ease of access. Cloud solutions enable real-time data analysis and remote monitoring, which help operators make timely decisions. These platforms also reduce IT infrastructure costs while providing seamless integration with Internet of Things (IoT) devices, boosting operational visibility. The flexibility of cloud-based analytics makes it ideal for managing dynamic workloads, forecasting demand, and optimizing pipeline efficiency.
U.S. midstream oil and gas analytics market is anticipated to exceed USD 3.8 billion by 2034. This growth is fueled by the increasing investments in pipeline infrastructure and the adoption of cutting-edge technologies. Analytics tools are now essential for optimizing transportation, monitoring asset performance, and ensuring regulatory compliance. Additionally, the combination of AI and IoT technologies enables real-time monitoring and predictive maintenance, helping reduce operational downtime and costs.
Table of Contents
Chapter 1 Methodology & Scope
- 1.1 Market definitions
- 1.2 Base estimates & calculations
- 1.3 Forecast calculation
- 1.4 Data sources
- 1.4.1 Primary
- 1.4.2 Secondary
- 1.4.2.1 Paid
- 1.4.2.2 Public
Chapter 2 Executive Summary
- 2.1 Industry synopsis, 2021 – 2034
Chapter 3 Industry Insights
- 3.1 Industry ecosystem analysis
- 3.2 Regulatory landscape
- 3.3 Industry impact forces
- 3.3.1 Growth drivers
- 3.3.2 Industry pitfalls & challenges
- 3.4 Growth potential analysis
- 3.5 Porter's analysis
- 3.5.1 Bargaining power of suppliers
- 3.5.2 Bargaining power of buyers
- 3.5.3 Threat of new entrants
- 3.5.4 Threat of substitutes
- 3.6 PESTEL analysis
Chapter 4 Competitive landscape, 2024
- 4.1 Strategic dashboard
- 4.2 Innovation & sustainability landscape
Chapter 5 Market Size and Forecast, By Deployment, 2021 – 2034 (USD Million)
- 5.1 Key trends
- 5.2 On premise
- 5.3 Hosted
Chapter 6 Market Size and Forecast, By Service, 2021 – 2034 (USD Million)
- 6.1 Key trends
- 6.2 Professional
- 6.3 Cloud
- 6.4 Integration
Chapter 7 Market Size and Forecast, By Application, 2021 – 2034 (USD Million)
- 7.1 Key trends
- 7.2 Pipeline SCADA
- 7.3 Fleet
- 7.4 Storage optimization
Chapter 8 Market Size and Forecast, By Region, 2021 – 2034 (USD Million)
- 8.1 Key trends
- 8.2 North America
- 8.2.1 U.S.
- 8.2.2 Canada
- 8.2.3 Mexico
- 8.3 Europe
- 8.3.1 UK
- 8.3.2 France
- 8.3.3 Germany
- 8.3.4 Italy
- 8.3.5 Russia
- 8.3.6 Spain
- 8.4 Asia Pacific
- 8.4.1 China
- 8.4.2 Australia
- 8.4.3 India
- 8.4.4 Japan
- 8.4.5 South Korea
- 8.5 Middle East & Africa
- 8.5.1 Saudi Arabia
- 8.5.2 UAE
- 8.5.3 Turkey
- 8.5.4 South Africa
- 8.5.5 Egypt
- 8.6 Latin America
- 8.6.1 Brazil
- 8.6.2 Argentina
Chapter 9 Company Profiles
- 9.1 Accenture
- 9.2 Capgemini
- 9.3 Cisco Systems
- 9.4 Cognizant
- 9.5 Deloitte
- 9.6 Hewlett Packard Enterprise
- 9.7 Hitachi
- 9.8 IBM
- 9.9 Microsoft
- 9.10 Oracle
- 9.11 SAP
- 9.12 SAS Institute
- 9.13 Tableau Software
- 9.14 Teradata
- 9.15 TIBCO Software

