
|
市場調査レポート
商品コード
1699398
浮体式オフショア風力エネルギー市場の機会、成長促進要因、産業動向分析、2025年~2034年の予測Floating Offshore Wind Energy Market Opportunity, Growth Drivers, Industry Trend Analysis, and Forecast 2025-2034 |
||||||
カスタマイズ可能
|
|||||||
| 浮体式オフショア風力エネルギー市場の機会、成長促進要因、産業動向分析、2025年~2034年の予測 |
|
出版日: 2025年02月26日
発行: Global Market Insights Inc.
ページ情報: 英文 150 Pages
納期: 2~3営業日
|

全表示
- 概要
- 目次
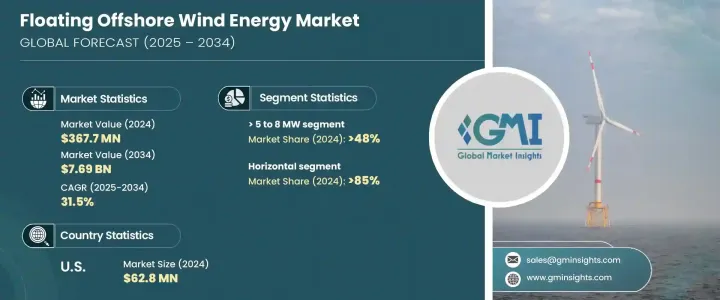
浮体式オフショア風力エネルギーの世界市場は、2024年に3億6,770万米ドルと評価され、2025年から2034年にかけて31.5%のCAGRで堅調に拡大すると予測されています。
市場の急成長は、技術別割当、関税設定、業界強化のための競争入札など、有利な政府政策に後押しされています。多くの国々が浮体式オフショア風発電プロジェクトの展開を加速させる戦略を積極的に実施しており、再生可能エネルギー・ソリューションに対する世界の需要増に対応する可能性を認識しています。クリーンエネルギーへの世界のシフトに伴い、各国が野心的なカーボンニュートラル目標の達成に努める中、洋上風力技術への投資は勢いを増しています。
浮体式オフショア風発電技術は、従来の固定式ウィンドファームに関連するいくつかの課題、特に従来の設置が不可能な水深の深い地域において、実行可能な解決策を提示しています。深海でより強力で安定した風力資源を利用できることは大きな利点であり、浮体式ウインドファームを大規模発電の魅力的な選択肢にしています。材料科学、タービン効率、浮体式プラットフォーム設計の絶え間ない進歩により、コストが下がり、世界中の開発者にとってより利用しやすい技術になると期待されています。さらに、エネルギー安全保障への懸念が高まるにつれ、政府や企業は、エネルギー源を多様化し化石燃料への依存を減らすための長期的なソリューションとして、洋上風力発電への関心を高めています。
| 市場範囲 | |
|---|---|
| 開始年 | 2024 |
| 予測年 | 2025-2034 |
| 開始金額 | 3億6,770万米ドル |
| 予測金額 | 76億9,000万米ドル |
| CAGR | 31.5% |
2024年の市場シェアは、水平浮体式オフショア風力タービンが85%を占めました。このセグメントのリーダーシップは、高効率、合理化された生産プロセス、メンテナンスの容易さによるもので、開発者にとって好ましい選択肢となっています。この分野では、浮体式プラットフォームの設計と性能を向上させるための研究開発に多額の投資が行われています。材料と製造技術の継続的な改善により、浮体式風力タービンはコスト効率と耐久性が向上しており、こうしたシステムの需要をさらに押し上げています。
浮体式オフショア風発電市場は、タービン容量に基づいて分類され、2MW超から12MW超までのセグメントがあります。10~12MW超のカテゴリーが最も急成長を記録する見込みで、2034年までのCAGRは54%と予測されています。業界がタービンの大型化と高効率化に注力することは、エネルギー生産コスト全体を引き下げる上で極めて重要です。より大容量のタービンを開発することで、企業はより少ないユニットでより多くの電力を発電できるようになり、大幅なコスト削減につながります。最先端のタービン設計、高度な制御システム、革新的な素材への多額の投資が、この市場セグメントの成長をさらに後押ししています。
北米の浮体式オフショア風発電市場は、2024年に6,280万米ドルを創出しました。この分野は、再生可能エネルギー・プロジェクトを推進する政府の支援的な規制やインセンティブにより、加速度的に拡大しています。タービン価格が下落し、業界の生産能力が拡大するにつれて、浮体式オフショア風発電の需要は増加の一途をたどっています。米国は、世界のエネルギー転換の重要なプレーヤーとして台頭しており、再生可能エネルギー目標を達成し、クリーンエネルギーの展望における地位を強化するために、洋上風力エネルギーに多額の投資を行っています。
目次
第1章 調査手法と調査範囲
第2章 エグゼクティブサマリー
第3章 業界洞察
- 業界エコシステム
- 規制状況
- 業界への影響要因
- 促進要因
- 業界の潜在的リスク&課題
- 成長ポテンシャル分析
- 価格動向分析
- ポーター分析
- PESTEL分析
第4章 競合情勢
- イントロダクション
- 戦略ダッシュボード
- イノベーションとテクノロジーの展望
第5章 市場規模・予測:タービン定格別、2021年~2034年
- 主要動向
- 2 MW以下
- 2~5 MW
- 5~8 MW
- 8~10 MW
- 10~12MW
- 12 MW超
第6章 市場規模・予測:軸別、2021年~2034年
- 主要動向
- 水平
- アップウインド
- ダウンウィンド
- 垂直
第7章 市場規模・予測:コンポーネント別、2021年~2034年
- 主要動向
- ブレード
- タワー
- その他
第8章 市場規模・予測:深さ別、2021年~2034年
- 主要動向
- 30 m以下
- 30 m~50 m
- 50 m超
第9章 市場規模・予測:地域別、2021年~2034年
- 主要動向
- 北米
- 米国
- カナダ
- 欧州
- ドイツ
- 英国
- フランス
- スウェーデン
- ポーランド
- デンマーク
- ポルトガル
- アイルランド
- ベルギー
- アジア太平洋
- 中国
- インド
- 日本
- 韓国
- ベトナム
- 世界のその他の地域
第10章 企業プロファイル
- Equinor ASA
- General Electric
- Global Energy(Group)Limited
- Hexicon
- Nexans
- Ørsted
- Prysmian Group
- RWE
- Sumitomo Electric Industries
- Simply Blue Group
- Siemens Gamesa Renewable Energy
- Vattenfall AB
- Vestas
The Global Floating Offshore Wind Energy Market was valued at USD 367.7 million in 2024 and is projected to expand at a robust CAGR of 31.5% from 2025 to 2034. The market's rapid growth is fueled by favorable government policies, including technology-specific quotas, set tariffs, and competitive auctions designed to strengthen the industry. Many countries are actively implementing strategies to accelerate the deployment of floating offshore wind projects, recognizing their potential in addressing the world's increasing demand for renewable energy solutions. With the global shift toward clean energy, investments in offshore wind technology are gaining momentum as nations strive to meet ambitious carbon neutrality goals.
Floating offshore wind technology presents a viable solution to several challenges associated with traditional fixed-bottom wind farms, particularly in regions with deep waters where conventional installations are not feasible. The ability to harness stronger and more consistent wind resources in deep-sea locations is a significant advantage, making floating wind farms an attractive option for large-scale power generation. Continuous advancements in material sciences, turbine efficiency, and floating platform designs are expected to drive down costs, making the technology more accessible to developers worldwide. Additionally, as energy security concerns grow, governments and corporations are increasingly looking toward offshore wind as a long-term solution to diversify energy sources and reduce dependency on fossil fuels.
| Market Scope | |
|---|---|
| Start Year | 2024 |
| Forecast Year | 2025-2034 |
| Start Value | $367.7 Million |
| Forecast Value | $7.69 Billion |
| CAGR | 31.5% |
In 2024, the horizontal floating offshore wind turbine segment accounted for a dominant market share of 85%. This segment's leadership can be attributed to its high efficiency, streamlined production processes, and ease of maintenance, making it a preferred choice for developers. The sector is witnessing significant investment in research and development to enhance floating platform design and performance. With continuous improvements in materials and manufacturing techniques, floating wind turbines are becoming more cost-effective and durable, driving further demand for these systems.
The floating offshore wind energy market is categorized based on turbine capacity, with segments ranging from >2 MW to >12 MW. The >10 to 12 MW category is expected to register the fastest growth, projected at a CAGR of 54% through 2034. The industry's focus on increasing turbine size and efficiency is critical in lowering overall energy production costs. By developing higher-capacity turbines, companies can generate more electricity with fewer units, leading to substantial cost reductions. Significant investments in cutting-edge turbine designs, advanced control systems, and innovative materials are further propelling this market segment's growth.
North America floating offshore wind energy market generated USD 62.8 million in 2024. The sector is experiencing accelerated expansion due to supportive government regulations and incentives promoting renewable energy projects. As turbine prices decline and industry capacity expands, demand for floating offshore wind energy continues to rise. The United States is emerging as a key player in the global energy transition, investing heavily in offshore wind energy to meet its renewable energy targets and strengthen its position in the clean energy landscape.
Table of Contents
Chapter 1 Methodology & Scope
- 1.1 Research design
- 1.2 Base estimates & calculations
- 1.3 Forecast model
- 1.4 Primary research & validation
- 1.4.1 Primary sources
- 1.4.2 Data mining sources
- 1.5 Market definitions
Chapter 2 Executive Summary
- 2.1 Industry 3600 synopsis, 2021 – 2034
Chapter 3 Industry Insights
- 3.1 Industry ecosystem
- 3.2 Regulatory landscape
- 3.3 Industry impact forces
- 3.3.1 Growth drivers
- 3.3.2 Industry pitfalls & challenges
- 3.4 Growth potential analysis
- 3.5 Price trend analysis
- 3.6 Porter's analysis
- 3.6.1 Bargaining power of suppliers
- 3.6.2 Bargaining power of buyers
- 3.6.3 Threat of new entrants
- 3.6.4 Threat of substitutes
- 3.7 PESTEL analysis
Chapter 4 Competitive landscape, 2024
- 4.1 Introduction
- 4.2 Strategic dashboard
- 4.3 Innovation & technology landscape
Chapter 5 Market Size and Forecast, By Turbine Rating, 2021 – 2034 (USD Million & MW)
- 5.1 Key trends
- 5.2 ≤ 2 MW
- 5.3 >2 to 5 MW
- 5.4 >5 to 8 MW
- 5.5 >8 to 10 MW
- 5.6 >10 to 12 MW
- 5.7 > 12 MW
Chapter 6 Market Size and Forecast, By Axis, 2021 – 2034 (USD Million & MW)
- 6.1 Key trends
- 6.2 Horizontal
- 6.2.1 Up-wind
- 6.2.2 Downwind
- 6.3 Vertical
Chapter 7 Market Size and Forecast, By Component, 2021 – 2034 (USD Million & MW)
- 7.1 Key trends
- 7.2 Blade
- 7.3 Tower
- 7.4 Others
Chapter 8 Market Size and Forecast, By Depth, 2021 – 2034 (USD Million & MW)
- 8.1 Key trends
- 8.2 ≤ 30 m
- 8.3 >30 m to ≤ 50 m
- 8.4 > 50 m
Chapter 9 Market Size and Forecast, By Region, 2021 – 2034 (USD Million & MW)
- 9.1 Key trends
- 9.2 North America
- 9.2.1 U.S.
- 9.2.2 Canada
- 9.3 Europe
- 9.3.1 Germany
- 9.3.2 UK
- 9.3.3 France
- 9.3.4 Sweden
- 9.3.5 Poland
- 9.3.6 Denmark
- 9.3.7 Portugal
- 9.3.8 Ireland
- 9.3.9 Belgium
- 9.4 Asia Pacific
- 9.4.1 China
- 9.4.2 India
- 9.4.3 Japan
- 9.4.4 South Korea
- 9.4.5 Vietnam
- 9.5 Rest of World
Chapter 10 Company Profiles
- 10.1 Equinor ASA
- 10.2 General Electric
- 10.3 Global Energy (Group) Limited
- 10.4 Hexicon
- 10.5 Nexans
- 10.6 Ørsted
- 10.7 Prysmian Group
- 10.8 RWE
- 10.9 Sumitomo Electric Industries
- 10.10 Simply Blue Group
- 10.11 Siemens Gamesa Renewable Energy
- 10.12 Vattenfall AB
- 10.13 Vestas

