
|
市場調査レポート
商品コード
1667117
マイクロガスタービンの市場機会、成長促進要因、産業動向分析、2025年~2034年予測Micro Gas Turbine Market Opportunity, Growth Drivers, Industry Trend Analysis, and Forecast 2025 - 2034 |
||||||
カスタマイズ可能
|
|||||||
| マイクロガスタービンの市場機会、成長促進要因、産業動向分析、2025年~2034年予測 |
|
出版日: 2024年12月03日
発行: Global Market Insights Inc.
ページ情報: 英文 225 Pages
納期: 2~3営業日
|

全表示
- 概要
- 目次
マイクロガスタービンの世界市場は、2024年に1億1,530万米ドルとなり、2025年から2034年にかけてCAGR7.2%で目覚ましい成長を遂げると予測されています。
この成長の原動力は、石油・ガスの遠隔操作、特にオフショアや孤立した坑井での信頼性の高い電力ソリューションに対する需要の高まりです。同市場はまた、最先端の燃焼技術の進歩とともに、航空宇宙・防衛分野での用途拡大からも恩恵を受けています。さらに、分散型で信頼性の高いエネルギーソリューションに対するニーズの高まりが、世界中でマイクロガスタービンの採用を後押しし続けています。
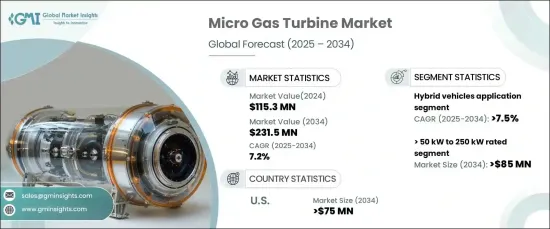
出力50kW~250kWのマイクロガスタービンは、2034年までに8,500万米ドルを生み出すと予測され、世界のエネルギー情勢における重要なソリューションとして位置づけられています。これらのシステムは、地域暖房システムへのシームレスな統合や、世界のエネルギー効率目標との整合性により、急速に普及しています。都市化が加速するにつれ、系統連系エネルギーソリューションに対する需要と商業インフラの開発が、市場の成長をさらに後押ししています。さらに、タービンは再生可能エネルギー源と互換性があり、オフグリッド用途で有用であるため、さまざまな産業で不可欠な選択肢となっています。
| 市場範囲 | |
|---|---|
| 開始年 | 2024年 |
| 予測年 | 2025年~2034年 |
| 開始金額 | 1億1,530万米ドル |
| 予測金額 | 2億3,150万米ドル |
| CAGR | 7.2% |
ハイブリッド車用マイクロガスタービンの需要は、2034年までCAGR7.5%という驚異的な成長を遂げると予測されています。この急成長の背景には、長距離電気自動車の需要の高まりと、エネルギー効率の高い輸送ソリューションへの注目の高まりがあります。化石燃料への依存を減らすことを目的とした主な開発と、インフラ整備への投資の増加が、この成長の主な要因です。さらに、活況を呈する海洋観光産業と豪華造船への傾向の高まりが、海洋用途のマイクロガスタービンに新たな機会をもたらしています。
米国のマイクロガスタービン業界は、2034年までに7,500万米ドルに達すると予想されており、業界における主導権を確固たるものにしています。遠隔地の石油・ガス事業、特に送電網へのアクセスが限られている地域で、これらのタービンが広く採用されていることが、成長の主な要因です。掘削リグ、パイプラインステーション、坑井現場などの重要な用途に独立した発電を提供する能力が、その魅力を高めています。さらに、老朽化したエネルギーインフラを近代化し、従来の発電方法への依存を減らそうとする動きが、米国の市場需要をさらに押し上げています。
目次
第1章 調査手法と調査範囲
- 市場範囲と定義
- 市場推計・予測パラメータ
- 予測計算
- データソース
- 一次
- 二次
- 有料
- 公的
第2章 エグゼクティブサマリー
第3章 業界洞察
- 業界エコシステム分析
- 規制状況
- 業界への影響要因
- 成長促進要因
- 業界の潜在的リスク・課題
- 成長可能性分析
- ポーター分析
- 供給企業の交渉力
- 買い手の交渉力
- 新規参入業者の脅威
- 代替品の脅威
- PESTEL分析
第4章 競合情勢
- イントロダクション
- 戦略的展望
- イノベーションと持続可能性の展望
第5章 市場規模・予測:容量別、2021年~2034年
- 主要動向
- 50 kW以下
- 50 kW~250 kW
- 250 kW~500 kW
- 500 kW以上
第6章 市場規模・予測:用途別、2021年~2034年
- 主要動向
- 発電
- 石油・ガス
- 商業・産業用CHP
- 再生可能エネルギー
- ハイブリッド車
- 海洋
- その他
第7章 市場規模・予測:地域別、2021年~2034年
- 主要動向
- 北米
- 米国
- カナダ
- 欧州
- 英国
- フランス
- ドイツ
- ロシア
- ノルウェー
- オランダ
- アジア太平洋
- 中国
- オーストラリア
- 日本
- インド
- 韓国
- 中東・アフリカ
- サウジアラビア
- アラブ首長国連邦
- 南アフリカ
- ラテンアメリカ
- ブラジル
- アルゼンチン
第8章 企業プロファイル
- Aerostrovilos
- Ansaldo Energia
- Aurelia Turbines
- Bladon Jets
- Brayton Energy
- Capstone Turbine Corporation
- Destinus Energy
- Erlson Precision Components
- Flex Energy Solutions
- Kawasaki Gas Turbine
- MTT
- Solar Turbines
- Toyota Motor Corporation
- Turbotech Precision Engineering
The Global Micro Gas Turbine Market, valued at USD 115.3 million in 2024, is projected to experience impressive growth at a CAGR of 7.2% between 2025 and 2034. This growth is fueled by the rising demand for reliable power solutions in remote oil and gas operations, especially in offshore locations and isolated well sites. The market is also benefiting from expanded applications in aerospace and defense alongside advancements in cutting-edge combustion technologies. Moreover, the increasing need for decentralized and dependable energy solutions continues to boost the adoption of micro gas turbines worldwide.
Micro gas turbines in the >50 kW to 250 kW power range are forecasted to generate USD 85 million by 2034, positioning themselves as a vital solution in the global energy landscape. These systems are rapidly gaining popularity due to their seamless integration into district heating systems and alignment with global energy efficiency goals. As urbanization accelerates, the demand for grid-connected energy solutions and the development of commercial infrastructure further support market growth. Additionally, the turbines' compatibility with renewable energy sources and utility in off-grid applications make them an indispensable choice across various industries.
| Market Scope | |
|---|---|
| Start Year | 2024 |
| Forecast Year | 2025-2034 |
| Start Value | $115.3 Million |
| Forecast Value | $231.5 Million |
| CAGR | 7.2% |
The demand for micro gas turbines in hybrid vehicles is projected to grow at an impressive CAGR of 7.5% through 2034. This surge is driven by the rising demand for long-range electric vehicles and a growing focus on energy-efficient transportation solutions. Government initiatives aimed at reducing fossil fuel dependency and increasing investments in infrastructure development are key contributors to this growth. Furthermore, the booming maritime tourism industry and a growing trend toward luxury shipbuilding are creating new opportunities for micro gas turbines in marine applications.
The U.S. micro gas turbine industry is expected to reach USD 75 million by 2034, cementing its leadership in the industry. The widespread adoption of these turbines in remote oil and gas operations, particularly in areas with limited grid access, is a primary growth driver. Their ability to provide independent power generation for critical applications such as drilling rigs, pipeline stations, and well sites enhances their appeal. Additionally, the push to modernize aging energy infrastructure and reduce reliance on traditional power generation methods is further propelling market demand in the U.S.
Table of Contents
Chapter 1 Methodology & Scope
- 1.1 Market scope & definitions
- 1.2 Market estimates & forecast parameters
- 1.3 Forecast calculation
- 1.4 Data sources
- 1.4.1 Primary
- 1.4.2 Secondary
- 1.4.2.1 Paid
- 1.4.2.2 Public
Chapter 2 Executive Summary
- 2.1 Industry synopsis, 2021 - 2034
Chapter 3 Industry Insights
- 3.1 Industry ecosystem analysis
- 3.2 Regulatory landscape
- 3.3 Industry impact forces
- 3.3.1 Growth drivers
- 3.3.2 Industry pitfalls & challenges
- 3.4 Growth potential analysis
- 3.5 Porter's Analysis
- 3.5.1 Bargaining power of suppliers
- 3.5.2 Bargaining power of buyers
- 3.5.3 Threat of new entrants
- 3.5.4 Threat of substitutes
- 3.6 PESTEL Analysis
Chapter 4 Competitive Landscape, 2024
- 4.1 Introduction
- 4.2 Strategic outlook
- 4.3 Innovation & sustainability landscape
Chapter 5 Market Size and Forecast, By Capacity, 2021 – 2034 (kW & USD Million)
- 5.1 Key trends
- 5.2 ≤ 50 kW
- 5.3 > 50 kW to 250 kW
- 5.4 > 250 kW to 500 kW
- 5.5 > 500 kW
Chapter 6 Market Size and Forecast, By Application, 2021 – 2034 (kW & USD Million)
- 6.1 Key trends
- 6.2 Power generation
- 6.3 Oil & gas
- 6.4 Commercial & industrial CHP
- 6.5 Renewable
- 6.6 Hybrid vehicles
- 6.7 Marine
- 6.8 Others
Chapter 7 Market Size and Forecast, By Region, 2021 – 2034 (kW & USD Million)
- 7.1 Key trends
- 7.2 North America
- 7.2.1 U.S.
- 7.2.2 Canada
- 7.3 Europe
- 7.3.1 UK
- 7.3.2 France
- 7.3.3 Germany
- 7.3.4 Russia
- 7.3.5 Norway
- 7.3.6 Netherlands
- 7.4 Asia Pacific
- 7.4.1 China
- 7.4.2 Australia
- 7.4.3 Japan
- 7.4.4 India
- 7.4.5 South Korea
- 7.5 Middle East & Africa
- 7.5.1 Saudi Arabia
- 7.5.2 UAE
- 7.5.3 South Africa
- 7.6 Latin America
- 7.6.1 Brazil
- 7.6.2 Argentina
Chapter 8 Company Profiles
- 8.1 Aerostrovilos
- 8.2 Ansaldo Energia
- 8.3 Aurelia Turbines
- 8.4 Bladon Jets
- 8.5 Brayton Energy
- 8.6 Capstone Turbine Corporation
- 8.7 Destinus Energy
- 8.8 Erlson Precision Components
- 8.9 Flex Energy Solutions
- 8.10 Kawasaki Gas Turbine
- 8.11 MTT
- 8.12 Solar Turbines
- 8.13 Toyota Motor Corporation
- 8.14 Turbotech Precision Engineering

