
|
市場調査レポート
商品コード
1666555
水蒸気改質水素生成の市場機会、成長促進要因、産業動向分析、2025年~2034年予測Steam Methane Reforming Hydrogen Generation Market Opportunity, Growth Drivers, Industry Trend Analysis, and Forecast 2025 - 2034 |
||||||
カスタマイズ可能
|
|||||||
| 水蒸気改質水素生成の市場機会、成長促進要因、産業動向分析、2025年~2034年予測 |
|
出版日: 2024年12月09日
発行: Global Market Insights Inc.
ページ情報: 英文 75 Pages
納期: 2~3営業日
|

全表示
- 概要
- 目次
世界の水蒸気改質水素生成市場は、2024年に1,464億米ドルに達し、2025年から2034年にかけてCAGR6.2%で成長すると予測されています。
SMR技術は、天然ガスのメタンを水蒸気と触媒で加熱し、有機合成やエネルギー用途に広く使用される一酸化炭素と水素の混合物を生成します。
新興経済諸国における原油消費量の増加と精製インフラへの投資は、水素メーカーに大きなビジネスチャンスをもたらしています。よりクリーンな燃料の採用を促進する政策と、精製への大規模な投資は、業界の情勢を一変させています。ガソリンやディーゼルなどの燃料に含まれる硫黄分を減らすことを目的とした規制の枠組みやインセンティブプログラムが、SMR水素生成技術の需要を促進しています。
| 市場範囲 | |
|---|---|
| 開始年 | 2024年 |
| 予測年 | 2025年~2034年 |
| 開始金額 | 1,464億米ドル |
| 予測金額 | 2,840億米ドル |
| CAGR | 6.2% |
市場は用途別に発電、石油精製、化学輸送、産業エネルギー、その他に区分されます。輸送部門は、2034年までに115億米ドルを生み出すと予想されています。輸送の脱炭素化に向けた開発の高まりが、水素を動力源とする技術の開発につながっています。業界大手は、水素インフラの拡大と自動車への採用促進に注力しています。手頃な価格の電力へのアクセス、再生可能エネルギーの統合、水力資源といった要因が、エネルギー取引における水素の役割を強化し、欧州とアジア市場に大きな成長機会をもたらすと予想されます。
米国の水蒸気改質水素生成市場は、2034年までに245億米ドルに達すると予測されます。石油精製産業の堅調な見通しと、化学、自動車、電力などの分野で新たな産業施設を設立する政府の取り組みが相まって、製品需要を牽引すると予想されます。水素は、豊富な再生可能資源や天然資源からコスト効率よく製造できるため、エネルギー貯蔵に利用されるケースが増えています。さらに、グリーン水素の研究開発に焦点を当てた国際的な協力関係も、市場拡大をさらに後押しすると予想されます。
市場の成長は、水素製造プロセスの効率と持続可能性の向上を目指した技術進歩によってさらに支えられます。世界中の政府と産業界がカーボンニュートラルなエネルギーソリューションを優先する中、水蒸気改質は世界の水素需要を満たす上で極めて重要な役割を果たし続けています。その拡張性、コスト効率、現在のインフラとの互換性は、進化する水素経済の礎石となっています。
目次
第1章 調査手法と調査範囲
- 調査デザイン
- 基本推定と計算
- 予測モデル
- 一次調査と検証
- 一次ソース
- データマイニングソース
- 市場の定義
第2章 エグゼクティブサマリー
第3章 業界洞察
- 業界エコシステム
- 規制状況
- 業界への影響要因
- 成長促進要因
- 業界の潜在的リスク・課題
- 成長可能性分析
- ポーター分析
- 供給企業の交渉力
- 買い手の交渉力
- 新規参入業者の脅威
- 代替品の脅威
- PESTEL分析
第4章 競合情勢
- イントロダクション
- 戦略ダッシュボード
- イノベーションとテクノロジーの展望
第5章 市場規模・予測:用途別、2021年~2034年
- 主要動向
- 石油精製
- 化学
- 輸送
- 発電
- 産業エネルギー
- その他
第6章 市場規模・予測:地域別、2021年~2034年
- 主要動向
- 北米
- 米国
- カナダ
- メキシコ
- 欧州
- ドイツ
- 英国
- フランス
- イタリア
- オランダ
- ロシア
- アジア太平洋
- 中国
- 日本
- インド
- 中東・アフリカ
- サウジアラビア
- イラン
- アラブ首長国連邦
- 南アフリカ
- ラテンアメリカ
- ブラジル
- アルゼンチン
- チリ
第7章 企業プロファイル
- ALLY HI-TECH CO., LTD.
- Air Liquide
- Air Products & Chemicals, Inc.
- CALORIC
- HyGear
- HyGear
- Linde plc
- Mahler AGS GmbH
- Messer
- NUVERA FUEL CELLS, LLC
- Plug Power Inc.
- TAIYYON NIPPON SANSO CORPORATION
- Topsoe
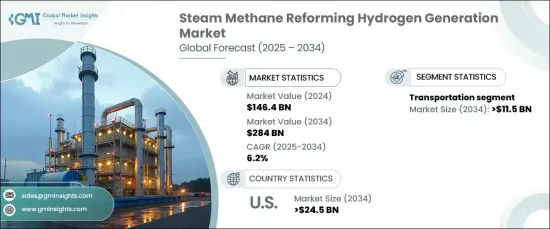
The Global Steam Methane Reforming Hydrogen Generation Market reached USD 146.4 billion in 2024 and is projected to grow at a CAGR of 6.2% between 2025 -2034. SMR technology involves heating methane from natural gas with steam and a catalyst to produce a mixture of carbon monoxide and hydrogen widely used in organic synthesis and energy applications.
Rising crude oil consumption in developing economies and investments in refining infrastructure are creating substantial opportunities for hydrogen producers. Policies promoting cleaner fuel adoption and significant investments in refining are transforming the industry landscape. Regulatory frameworks and incentive programs aimed at reducing sulfur content in fuels, such as gasoline and diesel, are driving the demand for SMR hydrogen generation technologies.
| Market Scope | |
|---|---|
| Start Year | 2024 |
| Forecast Year | 2025-2034 |
| Start Value | $146.4 Billion |
| Forecast Value | $284 Billion |
| CAGR | 6.2% |
The market is segmented by application into power generation, petroleum refining, chemical transportation, industrial energy, and others. The transportation sector is expected to generate USD 11.5 billion through 2034. Growing efforts to decarbonize transportation have led to the development of hydrogen-powered technologies. Major industry players are focusing on expanding hydrogen infrastructure and promoting its adoption in vehicles. Factors such as access to affordable electricity, renewable energy integration, and hydro resources are expected to strengthen hydrogen's role in energy trade, with significant growth opportunities in European and Asian markets.
United States steam methane reforming hydrogen generation market is projected to reach USD 24.5 billion by 2034. The robust outlook for the refining industry, coupled with government initiatives to establish new industrial facilities in sectors like chemicals, automotive, and power, is anticipated to drive product demand. Hydrogen is increasingly being utilized for energy storage, leveraging cost-effective production from abundant renewable and natural resources. Additionally, international collaborations focusing on green hydrogen research and development are expected to further bolster market expansion.
The market growth is further supported by technological advancement aimed at improving the efficiency and sustainability of hydrogen production processes. As governments and industries worldwide prioritize carbon-neutral energy solutions, steam methane reforming continues to play a pivotal role in meeting global hydrogen demand. Its scalability, cost-efficiency, and compatibility with current infrastructure make it a cornerstone of the evolving hydrogen economy.
Table of Contents
Chapter 1 Methodology & Scope
- 1.1 Research Design
- 1.2 Base estimates & calculations
- 1.3 Forecast model
- 1.4 Primary research & validation
- 1.4.1 Primary sources
- 1.4.2 Data mining sources
- 1.5 Market Definitions
Chapter 2 Executive Summary
- 2.1 Industry synopsis, 2021 – 2034
Chapter 3 Industry Insights
- 3.1 Industry ecosystem
- 3.2 Regulatory landscape
- 3.3 Industry impact forces
- 3.3.1 Growth drivers
- 3.3.2 Industry pitfalls & challenges
- 3.4 Growth potential analysis
- 3.5 Porter's analysis
- 3.5.1 Bargaining power of suppliers
- 3.5.2 Bargaining power of buyers
- 3.5.3 Threat of new entrants
- 3.5.4 Threat of substitutes
- 3.6 PESTEL analysis
Chapter 4 Competitive landscape, 2024
- 4.1 Introduction
- 4.2 Strategic dashboard
- 4.3 Innovation & technology landscape
Chapter 5 Market Size and Forecast, By Application, 2021 – 2034 (USD Billion)
- 5.1 Key trends
- 5.2 Petroleum refining
- 5.3 Chemical
- 5.4 Transportation
- 5.5 Power generation
- 5.6 Industry energy
- 5.7 Others
Chapter 6 Market Size and Forecast, By Region, 2021 – 2034 (USD Billion)
- 6.1 Key trends
- 6.2 North America
- 6.2.1 U.S.
- 6.2.2 Canada
- 6.2.3 Mexico
- 6.3 Europe
- 6.3.1 Germany
- 6.3.2 UK
- 6.3.3 France
- 6.3.4 Italy
- 6.3.5 Netherlands
- 6.3.6 Russia
- 6.4 Asia Pacific
- 6.4.1 China
- 6.4.2 Japan
- 6.4.3 India
- 6.5 Middle East & Africa
- 6.5.1 Saudi Arabia
- 6.5.2 Iran
- 6.5.3 UAE
- 6.5.4 South Africa
- 6.6 Latin America
- 6.6.1 Brazil
- 6.6.2 Argentina
- 6.6.3 Chile
Chapter 7 Company Profiles
- 7.1 ALLY HI-TECH CO., LTD.
- 7.2 Air Liquide
- 7.3 Air Products & Chemicals, Inc.
- 7.4 CALORIC
- 7.5 HyGear
- 7.6 HyGear
- 7.7 Linde plc
- 7.8 Mahler AGS GmbH
- 7.9 Messer
- 7.10 NUVERA FUEL CELLS, LLC
- 7.11 Plug Power Inc.
- 7.12 TAIYYON NIPPON SANSO CORPORATION
- 7.13 Topsoe

